The caption from the chart below:
After briefly looking at 2016-Q2 on Tuesday, 1 December 2015, after news indicating that the U.S. economy is slowing broke and investors speculated that news would delay a Fed rate hike, Fed Chair Janet Yellen effectively grabbed investors by the scruffs of their necks and forced them to focus on 2015-Q4 instead.
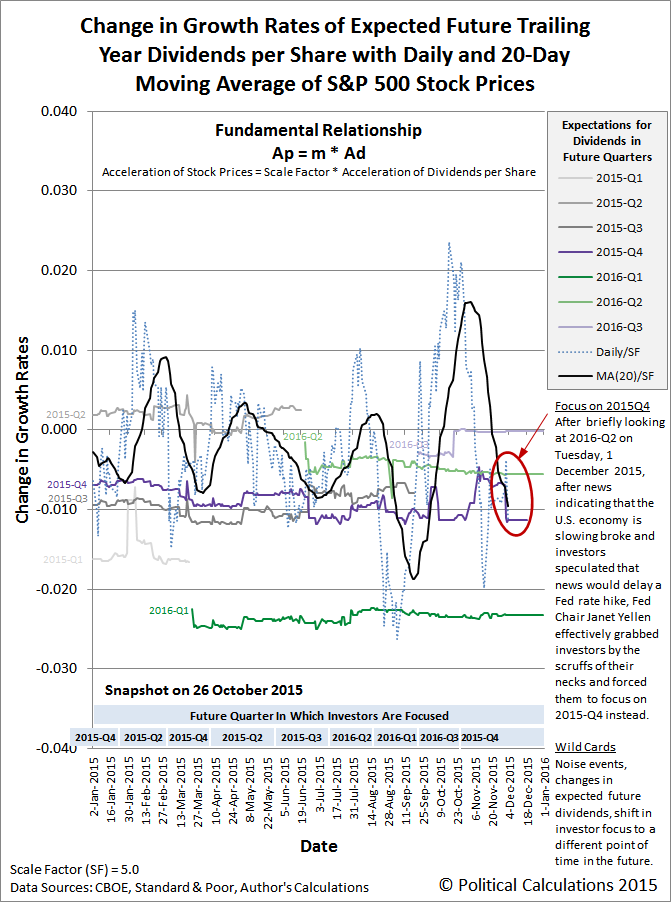
In terms of the alternative future trajectories that we forecast for U.S. stock prices, shown in the chart covering the fourth quarter of 2015 below, that shift in focus accounts for the changing trajectory of the S&P 500 since Monday, 30 November 2015, which went from the dotted dark orange line representing investors being focused on 2015-Q4, to the dashed purple line representing 2016-Q2, and then back to the dotted dark orange line representing 2015-Q4, as Janet Yellen showed the market who's in charge over the last two days.

The interesting thing is that the expectations for 2015-Q4's dividends per share deteriorated over the same time, falling by 18 cents per share, yet stock prices still behaved just as our model would predict as they took their quantum random walk over the last several days, almost perfectly converging with where our model's projected trajectory for 2015-Q4 moved over that same time.
That's largely because we are currently in a period where we have optimal conditions for producing this kind of forecast, with minimal noise to distract investors (indicated by the unshaded regions in our chart above).
Now, if you want to use our model to directly forecast where stock prices will go next, you really only need to anticipate the timing of news that would either prompt investors to once again shift their forward-looking focus from where it is now to a different point of time in the future, or that might alter their expectations for the fundamental driver for U.S. stock prices (their underlying dividends per share) at the future point of time they might focus upon.
If you can do that, you might be able to show Janet Yellen who's really in charge of the U.S. stock market.
Welcome to the blogosphere's toolchest! Here, unlike other blogs dedicated to analyzing current events, we create easy-to-use, simple tools to do the math related to them so you can get in on the action too! If you would like to learn more about these tools, or if you would like to contribute ideas to develop for this blog, please e-mail us at:
ironman at politicalcalculations
Thanks in advance!
Closing values for previous trading day.
This site is primarily powered by:
CSS Validation

RSS Site Feed
JavaScript
The tools on this site are built using JavaScript. If you would like to learn more, one of the best free resources on the web is available at W3Schools.com.
Other Cool Resources
Blog Roll


