Every now and again, we run into historic price data that we weren't expecting to find. When we do, we visualize it!
Today, we're exploring 150 years worth of the price of a bushel of wheat in the United States, first in a normal linear scale....
What do you know - it looks like a hockey stick!
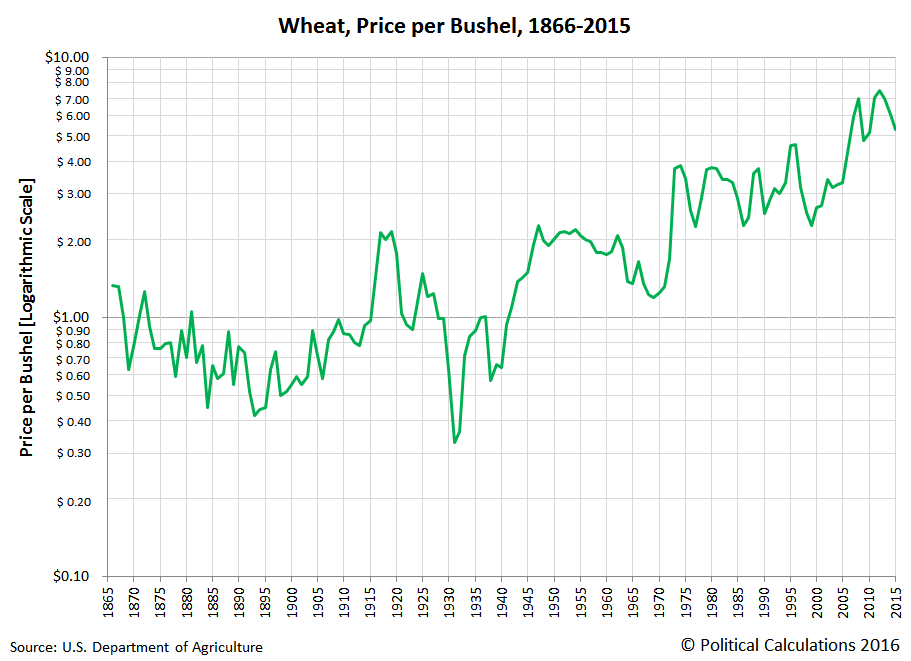
Now, let's see what it looks like on a logarithmic scale, which takes exponential growth and makes it look like a straight line....
In this latter chart, we see that inflation we see that the price of a bushel of wheat generally ranged between $0.50 and $1.50 per bushel during the first 80 years for which we have data, from 1866 through 1945, with some notable exceptions, such as inflationary highs of $2.10-$2.14 during and immediately after World War I (1917-1919) and the low of $0.33 per bushel in 1931, marking the bottom for wheat prices during the Great Depression.
But after World War II ended in 1945, we see that wheat prices quickly rose to $2.00 per bushel, only dropping significantly below that threshold during the years from 1963 through 1972. After which wheat prices have stepped up in two main increments, the first in the years from 1973 to 2005 where wheat prices ranged between $2.25 and $4.59 per bushel, then again after 2005, when wheat prices have consistently ranged between $5.00 and $7.48 per bushel.
For 2015, we've estimated the average price of wheat to be approximately $5.28 per bushel, although this is based on the average prices of a bushel of wheat during each month of 2015. Since it doesn't reflect a weighted average however, as the USDA reports and which would better reflect the prices that people actually paid farmers for the wheat they grew in that year, it should be considered to be a preliminary estimate.
Data Source
U.S. Department of Agriculture. National Agricultural Statistics Service. Northern Plains Regional Field Office. Kansas Wheat History. [PDF Document Internet Archive PDF Document]. Last Updated: October 2015. Accessed 7 May 2016.
Update 10 June 2020: We've noticed this post is getting quite a lot of traffic, where we've just found the link to the source for the data we've visualized is no longer working. Since the USDA has broken the link, here is a link to where you can find the Kansas Wheat History document we originally referenced at the Internet Archive: [PDF Document].
If you want to find potentially newer editions of the data, here's a filepath you might be able to use to track where the latest edition of the report might now be located.
- Start with the National Agriculture Statistics Service's Statistics by State page.
- Select your state of interest (for this example, it's Kansas)
- Under the Publications section, select Cooperative Projects
- The latest Kansas Wheat History report should be among the available publications in this section.
The final link we've pointed to here will take you to the October 2019 edition of the report, which is the latest available at the time of this update, at least until the USDA's data jocks might restructure all their datapaths again!...
Labels: data visualization, food, inflation
Welcome to the blogosphere's toolchest! Here, unlike other blogs dedicated to analyzing current events, we create easy-to-use, simple tools to do the math related to them so you can get in on the action too! If you would like to learn more about these tools, or if you would like to contribute ideas to develop for this blog, please e-mail us at:
ironman at politicalcalculations
Thanks in advance!
Closing values for previous trading day.
This site is primarily powered by:
CSS Validation
RSS Site Feed
JavaScript
The tools on this site are built using JavaScript. If you would like to learn more, one of the best free resources on the web is available at W3Schools.com.

