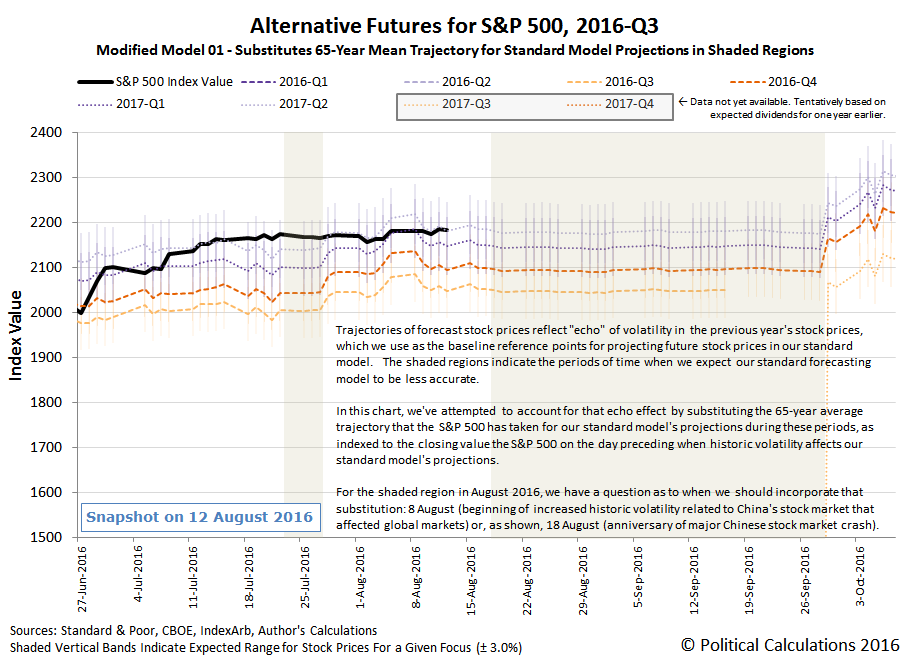
Although the S&P 500 reached new heights, the third week of August 2016 was really pretty boring as far as market action went!
The best way to describe what the market did during the week is that it drifted slightly higher, before drifing ever so slightly lower. As expected, investors appear to have maintained their focus on the distant future of 2017-Q2 in setting their expectations in making their current day investing decisions, which along with a lack of meaningful market moving news, largely accounts for the mostly steady trajectory of the S&P 500 during the week.
In the chart above, that small bump that you see in each of the alternative trajectories for the S&P 500 from 3 August 2016 to 11 August 2016 is the result of the echo of past volatility in stock prices, which is an artifact of our use of historic stock prices in the standard version of our futures-based model of how stock prices work. If you look ahead to later in this upcoming week, you'll see that the standard version of our model is about to be hit with a very large echo, as we're coming up on the anniversary of China's stock market meltdown, which began after China's surprise devaluation of its currency a year ago.
That's why we've developed a modified model, in which we're looking to substitute the past volalility-based echo effect with a more generic trajectory, as estimated using the typical trajectory that the S&P 500 has followed through each trading day of each year from 1950 through 2015.
Alternatively, we could just substitute another year's historic stock prices in our model, and in the past, we have with some success, as we effectively rebaseline our model with those historic prices.
But in doing so, we're really just trading one year's volatility for that of another year. For this experiment in forecasting, we're testing out whether a more generic trajectory can provide good enough results to improve the accuracy of our model's projections during those periods where we know in advance that our standard model will encounter the echo effect. The chart below shows what that looks like through the rest of 2016-Q3.
At least, if the market continues its low volatility behavior, we'll have something to hold our interest. Meanwhile, if you want proof that Week 3 of August 2016 was a pretty boring week for the S&P 500, here it is!
- Monday, 8 August 2016
- Tuesday, 9 August 2016
- Wednesday, 10 August 2016
-
- Oil ends down 2 percent as U.S. crude build offsets gasoline draw
- Wall Street drops as weak oil weighs on energy shares
- Oil fizzles on crude build; Wall St. ends lower
- Thursday, 11 August 2016
- Friday, 12 August 2016
Elsewhere, Barry Ritholtz succinctly summarizes the positives and negatives from the week's market and economic news.
Welcome to the blogosphere's toolchest! Here, unlike other blogs dedicated to analyzing current events, we create easy-to-use, simple tools to do the math related to them so you can get in on the action too! If you would like to learn more about these tools, or if you would like to contribute ideas to develop for this blog, please e-mail us at:
ironman at politicalcalculations
Thanks in advance!
Closing values for previous trading day.
This site is primarily powered by:
CSS Validation
RSS Site Feed
JavaScript
The tools on this site are built using JavaScript. If you would like to learn more, one of the best free resources on the web is available at W3Schools.com.

