Roughly every three months, we check in on the overall state of the new home market in the U.S. by estimating its market capitalization, where we take the average prices of new homes sold in the U.S. and multiply it by the number of new homes sold each month, then calculating its twelve month average to minimize the effects of seasonal variation in the monthly data. The following animated chart shows the results of that math, both in nominal terms and adjusted for inflation, for the period from December 1975 through the preliminary data just reported for February 2018. [If you're accessing this article on a site that republishes our RSS news feed, please click through to our site to see the animation.]
In nominal terms, after stalling in October 2017, the effective market cap of the U.S. new home sales market has resumed increasing, where its trailing twelve month average has reached $19.5 billion in February 2018. Adjusting the data for inflation to be in terms of constant February 2018 U.S. dollars indicates that the growth of the U.S. new home sales market has picked up after recently hitting a trough in November 2017.
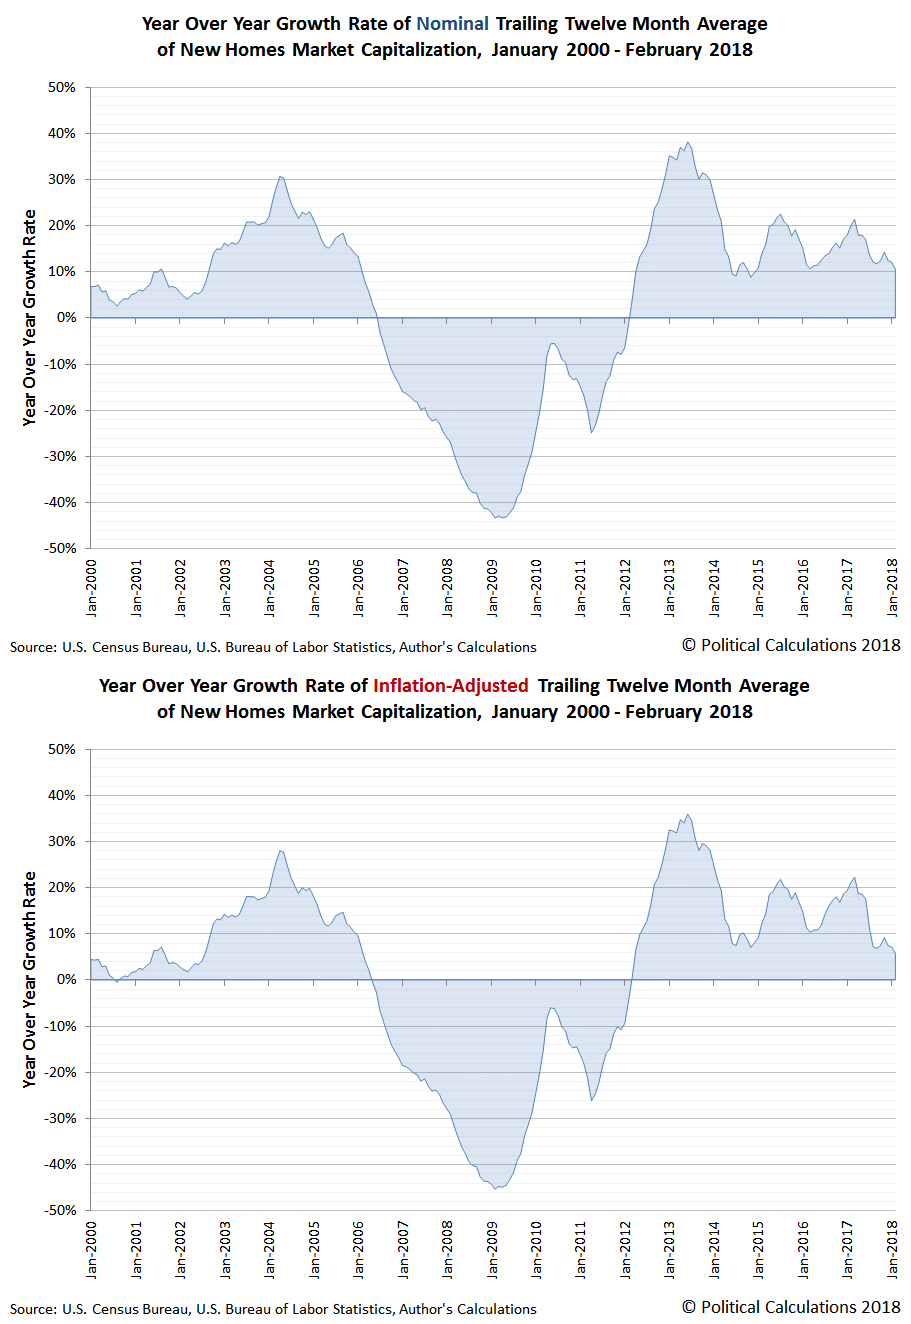
Our next animated chart shows the nominal and inflation-adjusted year over year growth rates for the trailing twelve month average of the market capitalization of new home sales from January 2000 through February 2018, where we can confirm that the market for new homes in the U.S. is decelerating.
The nominal year over year growth rate for U.S. new home sales last peaked at 21.4% in March 2017, which has since dropped to 10.6% in February 2018. Meanwhile, the inflation-adjusted growth rate has likewise declined over this period of time from 22.3% in March 2017 to 5.8% in February 2018.
This deceleration in part reflects a somewhat delayed reaction to the Federal Reserve's series of interest rate hikes, which have increased steadily since December 2016, and have risen by a full percentage point through February 2018. The Fed announced that it will increase its Federal Funds Rate by another quarter percentage point at its March 2018 meeting. The Fed actually began raising short term interest rates from a near-zero level back in December 2015, but did so at a slower and more irregular pace until December 2016. Meanwhile, the apparently greater deceleration in the real growth rate also reflects the effects of rising oil and commodity prices, as inflation has increased in the U.S., particularly in the latter part of 2017 through the present.
Will that decelerating trend continue? We'll check back to find out in another three months!
References
U.S. Census Bureau. New Residential Sales Historical Data. Houses Sold. [Excel Spreadsheet]. Accessed 26 March 2018.
U.S. Census Bureau. New Residential Sales Historical Data. Median and Average Sale Price of Houses Sold. [Excel Spreadsheet]. Accessed 26 March 2018.
U.S. Department of Labor Bureau of Labor Statistics. Consumer Price Index, All Urban Consumers - (CPI-U), U.S. City Average, All Items, 1982-84=100 [Online Application]. Accessed 26 March 2018.
Labels: real estate
Welcome to the blogosphere's toolchest! Here, unlike other blogs dedicated to analyzing current events, we create easy-to-use, simple tools to do the math related to them so you can get in on the action too! If you would like to learn more about these tools, or if you would like to contribute ideas to develop for this blog, please e-mail us at:
ironman at politicalcalculations
Thanks in advance!
Closing values for previous trading day.
This site is primarily powered by:
CSS Validation
RSS Site Feed
JavaScript
The tools on this site are built using JavaScript. If you would like to learn more, one of the best free resources on the web is available at W3Schools.com.
![Animation: Trailing Twelve Month Average New Home Sales Market Capitalization, Not Adjusted for Inflation [Current U.S. Dollars] and Adjusted for Inflation [Constant February 2018 U.S. Dollars], December 1975 - February 2018 Animation: Trailing Twelve Month Average New Home Sales Market Capitalization, Not Adjusted for Inflation [Current U.S. Dollars] and Adjusted for Inflation [Constant February 2018 U.S. Dollars], December 1975 - February 2018](https://blogger.googleusercontent.com/img/b/R29vZ2xl/AVvXsEh6T3Iwvpby1xaiMMvNKKLCgdXzatgtDRjQWoG4MdJKfGgm4gvRNQZFgZYaTHk9kJiuilOKQPW3qbZAnV7kHNkLnaqhsYJ2kPu4WVlLjsMwvDtrkHVWNtBjOaW5VAxtJ1yGmjmC/s1600/animation-ttma-new-home-sales-market-capitalization-nominal-and-inflation-adjusted-197512-to-201802.gif)
