May 2022 was a strong month for U.S. new home builders. We think the reasons why it was strong can be traced to both new home sale prices and mortgage rates taking something of a breather from their rapid escalation of recent months.
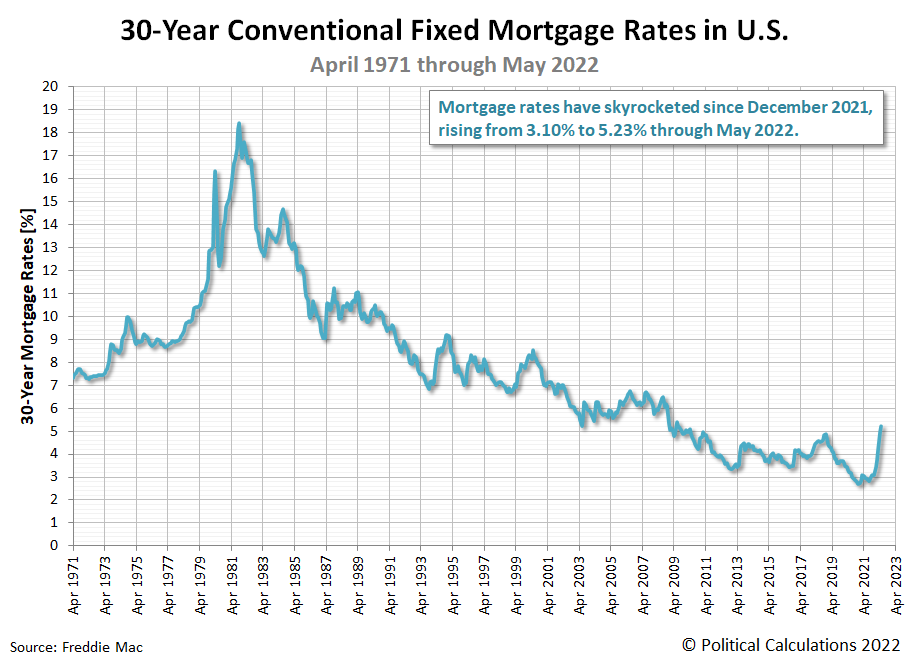
Between the two of these, mortgage rates grew more slowly, rising from an average of 4.98% in April to 5.23% in May 2022, which counts as a surprisingly small month-over-month change in the recent trend. The following chart shows that trend in the context of the average monthly U.S. 30-year fixed rate mortgage rates recorded from April 1971 through May 2022:
We think that relative pause provided an opportunity for American home buyers to jump into the new home market before mortgage rates might rise even higher, boosting the number of sales despite the market's rising prices and mortgage rates.
The next chart shows why taking that opportunity would be especially important to new home buyers. The basic mortgage payment for a median new home as a percentage of median household income ticked up from April 2022's initial estimate of 37.8% to 38.4%.
With mortgage rates resuming their Biden-era surge over the 5.5% threshold in June 2022, we anticipate this measure may soon reach or exceed the housing bubble era's level of unaffordability.
References
U.S. Census Bureau. New Residential Sales Historical Data. Houses Sold. [Excel Spreadsheet]. Accessed 24 June 2022.
U.S. Census Bureau. New Residential Sales Historical Data. Median and Average Sale Price of Houses Sold. [Excel Spreadsheet]. Accessed 24 June 2022.
Freddie Mac. 30-Year Fixed Rate Mortgages Since 1971. [Online Database]. Accessed 1 June 2022.
Labels: inflation, personal finance, real estate
Welcome to the blogosphere's toolchest! Here, unlike other blogs dedicated to analyzing current events, we create easy-to-use, simple tools to do the math related to them so you can get in on the action too! If you would like to learn more about these tools, or if you would like to contribute ideas to develop for this blog, please e-mail us at:
ironman at politicalcalculations
Thanks in advance!
Closing values for previous trading day.
This site is primarily powered by:
CSS Validation
RSS Site Feed
JavaScript
The tools on this site are built using JavaScript. If you would like to learn more, one of the best free resources on the web is available at W3Schools.com.

