Last week, the Bureau of Labor Statistics reported higher than expected job growth in the U.S. Total nonfarm payroll employment increased by 315,000 in August 2022 to a seasonally adjusted level of 152,744,000. Meanwhile, total employment captured in the BLS' monthly survey of households increased by 442,000 to reach an estimated level of 158,732,000. But because more Americans entered the civilian labor force during the month, the unemployment rate rose from 3.5% to 3.7%.
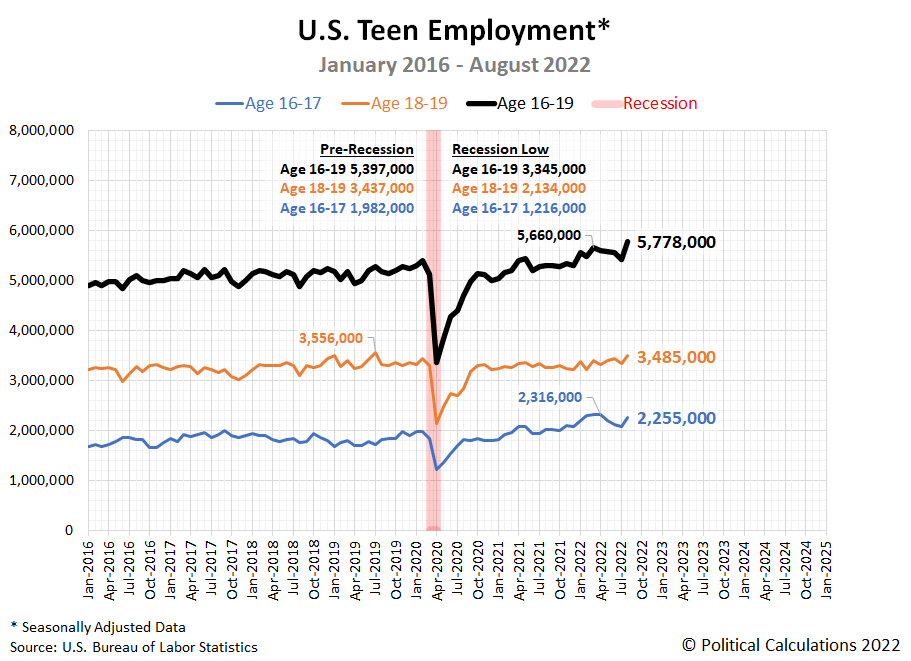
Those are the topline numbers from the report. Since we're following the employment situation for teens, we have to dig deeper into the household survey for that data. Here, we find that both the number of employed teens and the share of working among the Age 16-19 population in the U.S. surged during August 2022. The first chart shows the seasonally adjusted number of employed teens for Age 16-19 teens, along with the Age 16-17 and Age 18-19 subsets of that population from January 2016 through August 2022. Note: since each of these individual data series has been put through its own seasonal adjustment from the raw data, the numbers shown in the chart won't directly add together.
Starting with the Age 16-17 portion of the teen workforce, the number of working teens reversed a three month downtrend, jumping 179,000 to 2,255,000. Teens Age 18-19 increased by 142,000 to 3,485,000. The official total for all working teens increased by 363,000 to 5,778,000. Notice that while both the Age 16-17 and Age 18-19 subsets are both still below their peak values shown in the chart, the combined number of Age 16-19 year olds has hitthe highest level during the period covered by the chart.
The same is true when we look at the teen employment-to-population ratio for each demographic in the next chart:
Now, let's compare the month over month numeric change in the seasonally adjusted total number of working teens with the change in the total number of Americans counted as having jobs in the BLS' household survey. Total employment increased by 442,000, the number of working teens increased by 363,000, which would account for 82% of the net change. The gain in jobs appears to have been dominated by newly employed teenagers being added to the U.S. labor force.
Or would, if the seasonal adjustment didn't give these numbers an apples and oranges character. To address that deficiency, we dug deeper into month's household data to get the raw, nonseasonally adjusted numbers, which do directly add together.
Here, we found the total of employed Americans shrank by 353,000, dropping to 158,714,000 from July to August 2022. In this case, the seasonally adjusted figure showed an increase instead because this decline is much less than would be expected per the seasonal pattern for employment at this time of year. Looking at teens, we find the same pattern. We find the nonseasonally adjusted total number of employed teens dropped by 310,000 from July to August 2022. That figure represents 88% of the actual net month over month change in the household survey's count.
This outcome helps demonstrate the extent to which the employment situation for teens, the most marginal age demographic in the civilian labor force, can affect the topline numbers reported in the monthly employment situation report. It is why we pay attention to it. In August 2022, more teens staying at their jobs than expected accounted for the vast majority of all the positive net gain in the August 2022 report.
Reference
U.S. Bureau of Labor Statistics. Labor Force Statistics (Current Population Survey - CPS). [Online Database.] Accessed: 2 September 2022.
Labels: demographics, jobs
Welcome to the blogosphere's toolchest! Here, unlike other blogs dedicated to analyzing current events, we create easy-to-use, simple tools to do the math related to them so you can get in on the action too! If you would like to learn more about these tools, or if you would like to contribute ideas to develop for this blog, please e-mail us at:
ironman at politicalcalculations
Thanks in advance!
Closing values for previous trading day.
This site is primarily powered by:
CSS Validation
RSS Site Feed
JavaScript
The tools on this site are built using JavaScript. If you would like to learn more, one of the best free resources on the web is available at W3Schools.com.

