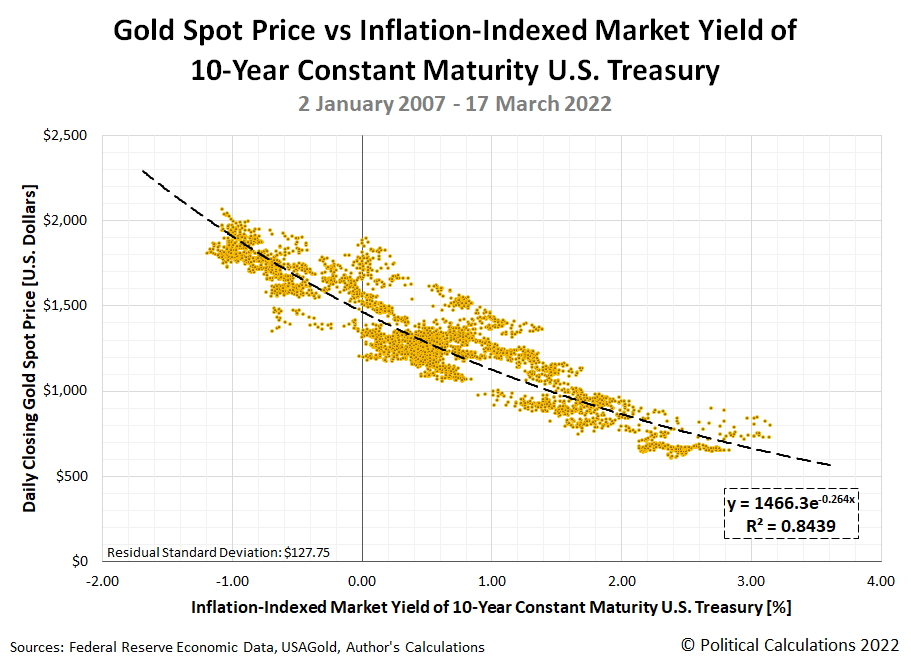
On 16 March 2022, after a nearly a year of letting building inflation in the U.S. go unaddressed, the U.S. Federal Reserve finally decided to do something about it. The Fed announced it would begin hiking interest rates, raising them above the near-zero level it had been maintaining. Coincidentally, a week later, we featured a snapshot of the inverse relationship between the price of gold and the inflation-adjusted yield of the 10-Year Constant Maturity Treasury Bond from 2 January 2007 through 17 March 2022. Here's the chart we featured:
It would be reasonable to expect that as the Fed has continued to hike interest rates, the inflation-adjusted yield of a 10-year U.S. Treasury would rise as well. And sure enough, that is what has happened in the five months since. It would also be reasonable for the price of gold to retrace its path along the curve shown in this chart, falling as real interest rates rise. We can confirm that's happened too. But as we're about to reveal in the next chart, by nowhere near as much as the relationship established in the previous 15 years implies:
The red line added to the chart tracks the daily spot price of gold with respect to the real yield of the 10-Year Constatn Maturity U.S. Treasury from 16 March 2022 through 19 August 2022. During this period, the price of gold has averaged being $439 higher than the level indicated by the black-dashed curve modelling the inverse relationship between these variables.
That outcome suggests the Fed's current strategy for combatting inflation may be failing to achieve the full effect Fed officials are counting upon. That's also despite their policies' seeming success in boosting the value of the U.S. dollar, which should also contribute to reducing the price of gold:
The dollar is soaring against the world's major currencies, heading for its biggest calendar year rise in almost 40 years and third biggest since President Richard Nixon took the dollar off the gold standard over half a century ago.
Will the Fed be worried? Not one bit.
Quite the opposite. All else equal, the dollar's strength will help cool price pressures by reducing import costs, and tighten financial conditions, both desired goals for Jerome Powell and colleagues as they try to bring 40-year high inflation back towards their 2% target.
15 August 2022 marked the 51st anniversary of Nixon's closure of the gold window, when an ounce of gold cost $43. If the price of gold had grown at an average of 2% per year and compounded monthly, that ounce would cost $119.25 today. On 15 August 2022, the price of an ounce of gold was $1,778.57.
Speaking of the rise in the value of the U.S. dollar:
The dollar is hovering around a 20-year peak against a basket of major currencies. It is up 13.5% so far this year - on course for its biggest calendar year rise since 1984, and third largest since the dollar's convertibility to gold ended in 1971.
There's that gold-based reference point again! Why does Reuters columnist Jamie McGeever keep going back to it unless it's somehow meaningful for measuring the Fed's performance? Let's assume it is, which raises some questions.
If the Fed was succeeding in reducing inflation it believes is transitory, shouldn't that calendar year rise in the relative value of the U.S. dollar be much higher? Shouldn't the price of gold have fallen much more than it has? Or has the inflation the Federal Reserve's and President Biden's policies wrought permanently ratcheted up its value?
Or is it all just a matter of time before the value of the U.S. dollar spikes upward even higher and the price of gold collapses? How long does the Federal Reserve think that might take?
Labels: data visualization, economics
Welcome to the blogosphere's toolchest! Here, unlike other blogs dedicated to analyzing current events, we create easy-to-use, simple tools to do the math related to them so you can get in on the action too! If you would like to learn more about these tools, or if you would like to contribute ideas to develop for this blog, please e-mail us at:
ironman at politicalcalculations
Thanks in advance!
Closing values for previous trading day.
This site is primarily powered by:
CSS Validation
RSS Site Feed
JavaScript
The tools on this site are built using JavaScript. If you would like to learn more, one of the best free resources on the web is available at W3Schools.com.

