Not long ago, we were asked about how inflation affects the price of gold. It's something of an occupational hazard, where a lot of people assume that because we know quite a lot about how stock prices work, that knowledge directly carries over to things like commodities.
For most commodities, like copper, or oil, or turkeys, we would default to supply and demand analysis or dig into the factors affecting their cost of production to explain their changes in prices over time.
Gold falls into a different category that doesn't fit well into that basic mold. Aside from its use in jewelry, it's not used in great quantity to support any industrial applications like nearly all other metals are. Instead, it's used in financial applications, often as a hedge for inflation. Which is to say that when inflation runs hot, the price of gold will rise. But not always. Something else affects it as well.
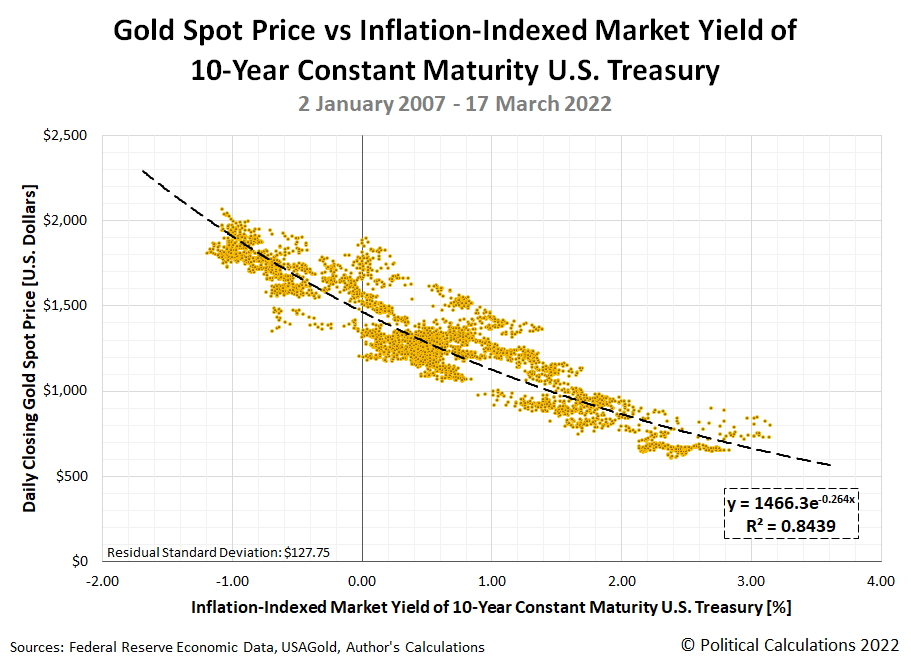
That something else would appear to be interest rates, where the recent history for gold prices points to their having an inverse relationship with inflation-indexed interest rates. By inverse relationship, that means that as real interest rates fall, the price of gold tends to rise in response. The following chart shows the relationship we found between the daily closing spot price for gold and the daily inflation-indexed market yield of 10-year constant maturity U.S. Treasuries over the past 15 years.
While the chart picks up the action at the start of January 2007, the pattern it shows began taking hold in 2006, coinciding with the deflation phase of the U.S. housing bubble. The inverse relationship we've identified only holds for the current period.
The most recent data point shown in the chart, for 17 March 2022, has the inflation-indexed market yield on 10-Year constant maturity U.S. Treasury securities at -0.71%, which is paired with gold's closing spot price for the day of $1,944.05. For reference, the nominal market yield for a 10-Year constant maturity U.S. Treasury was 2.20%. The inflation-indexed yield is negative because expected inflation rate over the 10 year period of the security is greater than the non-inflation indexed yield. That situation is consistent with a high price for gold.
After finding this relationship, we went searching for insight from other analysts who were already well familiar with it. Here's how Longtermtrends describes how gold prices work:
According to Erb and Harvey the correlation between real interest rates and the price of gold is -0.82. In other words, when real yields go down gold goes up. This correlation explains why inflation is gold's best friend while rate hikes are its worst enemy.
Here is a possible explanation for this relationship. Rising interest rates also mean rising opportunity costs of holding gold. Gold neither pays dividends nor interest. Thus, it is relatively expensive to hold it in the portfolio when real interest rates are high. On the other hand, when real yields are negative, holders of cash and bonds are losing wealth. In such a scenario, they are more prone to buy gold.
The Erb and Harvey study Longtermtrends references is from 2013, but it's good to see that the relationship we found is still very much in the same ballpark as the correlation they found. Just so, the price of gold is still governed by supply and demand. It's just that the demand for gold works quite a bit differently than it does for other commodities given its primary use as a hedge for negative real yields in today's financial applications.
References
Claude B. Erb and Campbell R. Harvey. The Golden Dilemma. Financial Analysts Journal. Vol. 69. No. 4. July/August 2013, pp 10-42. DOI: 10.2139/ssrn.2078535.
Federal Reserve Economic Data. Market Yield on U.S. Treasury Securities at 10-Year Constant Maturity, Inflation-Indexed. Online Database (Text File)]. Accessed 19 March 2022.
USAGold. Daily Gold Price History. [Online Database]. Accessed 19 March 2022.
Labels: data visualization, ideas, inflation, investing, personal finance
Welcome to the blogosphere's toolchest! Here, unlike other blogs dedicated to analyzing current events, we create easy-to-use, simple tools to do the math related to them so you can get in on the action too! If you would like to learn more about these tools, or if you would like to contribute ideas to develop for this blog, please e-mail us at:
ironman at politicalcalculations
Thanks in advance!
Closing values for previous trading day.
This site is primarily powered by:
CSS Validation
RSS Site Feed
JavaScript
The tools on this site are built using JavaScript. If you would like to learn more, one of the best free resources on the web is available at W3Schools.com.
