How do big changes in mortgage rates affect new home sales?
That question has become very relevant to the U.S. economy with the Federal Reserve scrambling to contain President Biden's inflation by hiking short term interest rates. Their actions have directly impacted 30-year conventional fixed mortgage rates, which have risen from December 2021's average of 3.1% to June 2022's 5.4% because of the Fed's rate hikes.
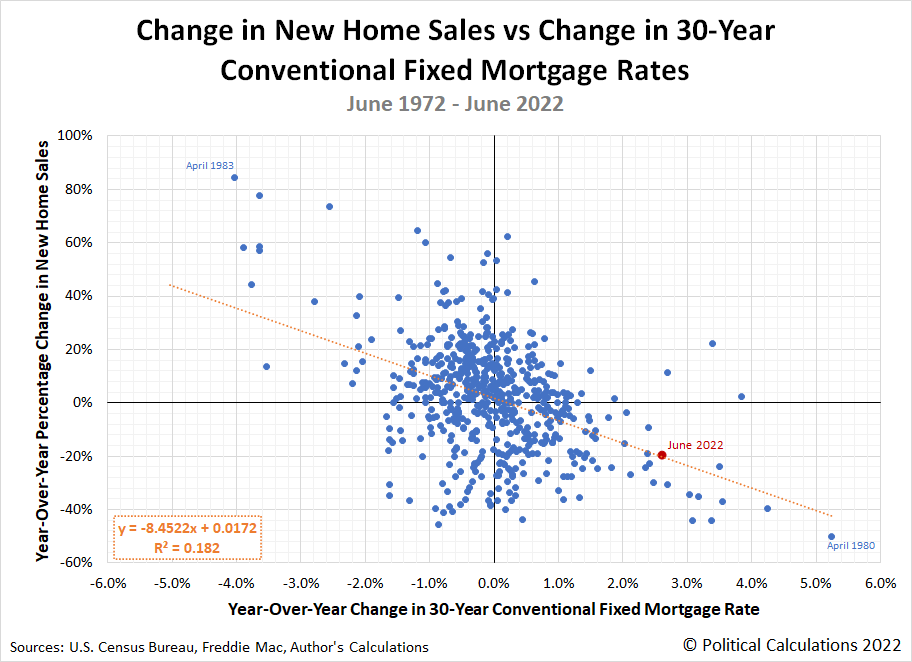
That's a big change in a relatively short period of time for mortgage rates. One that's bound to impact the sales of new homes. In our first chart, we've sought to quantify how much that impact might be by plotting the percentage change in year-over-year new home sales against the year-over-year change in mortgage rates using fifty years worth of monthly data.
A simple linear regression shows that changes in mortgages rates have an inverse relationship with changes in new home sales. Rising mortgage rates tend to coincide with negative changes in the sales of new homes, while falling mortgage rates coincide with increases in new home sales.
That makes sense because mortgage rates have a direct impact on the cost that homeowners pay on their mortgages. Given the same sale price, higher rates means a higher cost of ownership.
But the correlation between changes in mortgage rates and new home sales isn't as strong as you might think. The correlation coefficient (R²) is 0.182, which is relatively weak. In looking at the chart, it occurred to us that there's quite a lot of noise in the data associated with relatively small mortgage rate changes, which is where most of the changes are concentrated.
What would happen if we simply omitted the data where the absolute year over year change in mortgage rates was less than 1.0%? The next chart shows the results of that analysis.
Here, the correlation shows a moderately strong relationship between these two factors. Interestingly, there's little change in the linear regression itself after omitting the data, which still shows that for a given year-over-year change in mortgage rates, new home sales will move in the opposite direction by 8.5-9.0%. For June 2022, the most recent month for which we have initial data for new home sales, the 2.6% increase in mortgage rates over the past year corresponds to a negative 20% change in new home sales, which is nearly in line with what the linear regression would predict.
There's still quite a lot of noise in the underlying data however, so for us, it's not yet worth developing into a forecasting tool. Moderately strong correlations are mainly good for putting you in the right ballpark, so while they're useful for answering questions like how big mortgage rate changes affect new home sales, they come with a wider than desirable margin of error for telling you the exact change to expect when they occur.
Labels: economics, real estate
Welcome to the blogosphere's toolchest! Here, unlike other blogs dedicated to analyzing current events, we create easy-to-use, simple tools to do the math related to them so you can get in on the action too! If you would like to learn more about these tools, or if you would like to contribute ideas to develop for this blog, please e-mail us at:
ironman at politicalcalculations
Thanks in advance!
Closing values for previous trading day.
This site is primarily powered by:
CSS Validation
RSS Site Feed
JavaScript
The tools on this site are built using JavaScript. If you would like to learn more, one of the best free resources on the web is available at W3Schools.com.

