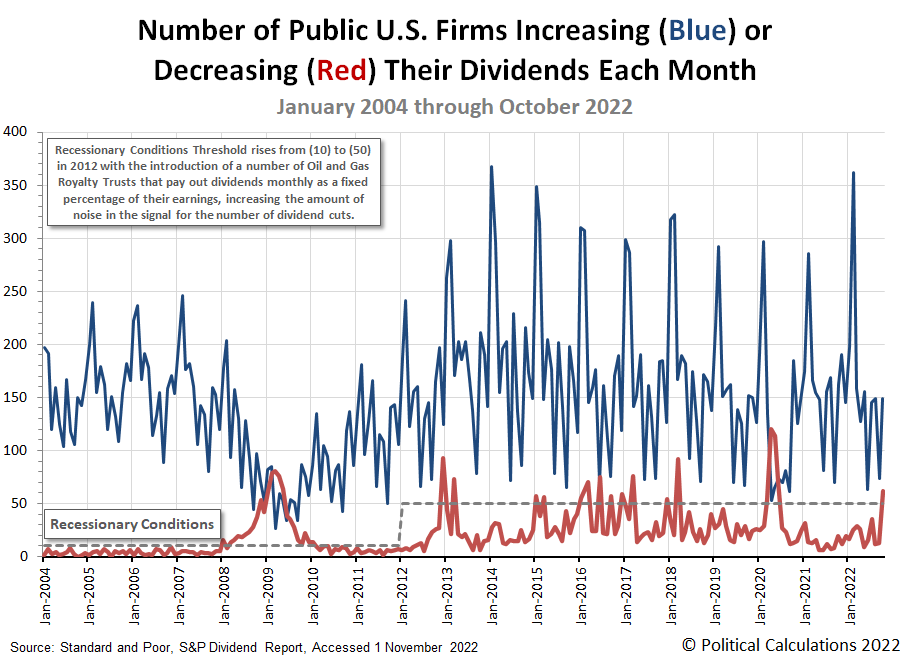
The number of U.S. firms either increasing or decreasing their dividends in any given month can tell us about the developing state of the U.S. economy. In October 2022, the number of announced dividend reductions sent a clear signal the U.S. economy is experiencing recessionary conditions.
Here's the latest update to our chart tracking monthly increases and decreases for dividends as reported by Standard and Poor for each month from January 2004 through October 2022.
The more serious signal is the reported spike in the number of U.S. firms that have announced dividend cuts. In October 2022, that number leapt above the threshold of 50 we've identified on the chart, which coincides with a significant level of distress for businesses within the U.S. economy. The number of dividend increases is also a tell, mainly because it is lower year-over-year, continuing 2022's negative trend for this measure.
Here's our summary of October 2022's dividend metadata:
- There were 3,267 U.S. firms declaring dividends in October 2022. That's a decrease of 815 from September 2022, and a decrease of 1,880 from the number of declarations recorded a year earlier in October 2021.
- A total of 59 U.S. firms declared they would pay a special (or extra) dividend in October 2022, up from September 2022's seasonal low of 33 and the same as did back in October 2021.
- 149 U.S. firms announced they would increase dividends during October 2022, an increase of 475 over September 2022's seasonal low, but a year-over-year decrease of 13 from October 2021's level.
- Standard and Poor reports 62 companies cut their dividends in October 2022. That's 49 more than did in September 2022 and 43 more than did a year earlier in October 2021.
- There were zero U.S. firms suspending (or omitting) their dividends in October 2022, continuing the trend established since June 2021. That trend now stands out as unusual with respect to the surge in announced dividend cuts, because the combination indicates the firms cutting dividends are not anticipating a mild level of distress they might simply weather and simply resume paying dividends at their set levels later.
We found the following fifteen announced dividend reductions in our sampling of October 2022's dividend declarations. This month's list includes six firms from the Oil and Gas sector, four Financial Services firms, three Real Estate Investment Trusts, and one firm each from the Transportation and Materials sectors of the U.S. economy. Meanwhile, over half the listed firms pay variable dividends, which are listed here because they are very sensitive to changing business conditions. If you're someone who becomes irrationally upset when fixed and variable dividend-paying companies are listed together as dividend cutters after they've reduced their dividends, get ready to white-knuckle your armrests.
- Generation Income Properties (REIT-Diversified) (NASDAQ: GIPR)
- Medalist Diversified (REIT-Diversified) (NASDAQ: MDRR)
- MV Oil Trust (NYSE: MVO)
- BP Prudhoe Bay Royalty Trust (NYSE: BPT)
- WhiteHorse Finance (NASDAQ: WHF)
- Blackstone Group (NYSE: BX)
- VOC Energy Trust (NYSE: VOC)
- Southern Copper (NYSE: SCCO)
- Permian Basin Royalty Trust (NYSE: PBT)
- Cross Timbers Royalty Trust (NYSE: CRT)
- Hugoton Royalty Trust (OTC: HGTXU)
- Sachem Capital (REIT-Mortgage) (NYSE: SACH)
- Fortress Transportation (NYSE: FTAI)
- First Business Financial Services (NASDAQ: FBIZ)
- Pioneer Natural Resources (NYSE: PXD)
- AllianceBernstein (NYSE: AB)
Dividend cuts are a near-real time indicator of potential distress for the businesses that declare them, particularly when their numbers begin accumulating above the market's typical noise level. With the exception of monthly dividend payers, the timing of dividend cuts follow about a quarter behind the changes in business conditions that compel them. Which is to say investors need to stay tuned, because the number of dividends cuts is catching up to negative conditions that have already developed within the economy.
References
Standard and Poor. S&P Market Attributes Web File. [Excel Spreadsheet]. Accessed 1 November 2022.
Standard and Poor. S&P Indicated Rate Change. [Excel Spreadsheet]. Accessed 1 November 2022.
Welcome to the blogosphere's toolchest! Here, unlike other blogs dedicated to analyzing current events, we create easy-to-use, simple tools to do the math related to them so you can get in on the action too! If you would like to learn more about these tools, or if you would like to contribute ideas to develop for this blog, please e-mail us at:
ironman at politicalcalculations
Thanks in advance!
Closing values for previous trading day.
This site is primarily powered by:
CSS Validation
RSS Site Feed
JavaScript
The tools on this site are built using JavaScript. If you would like to learn more, one of the best free resources on the web is available at W3Schools.com.
