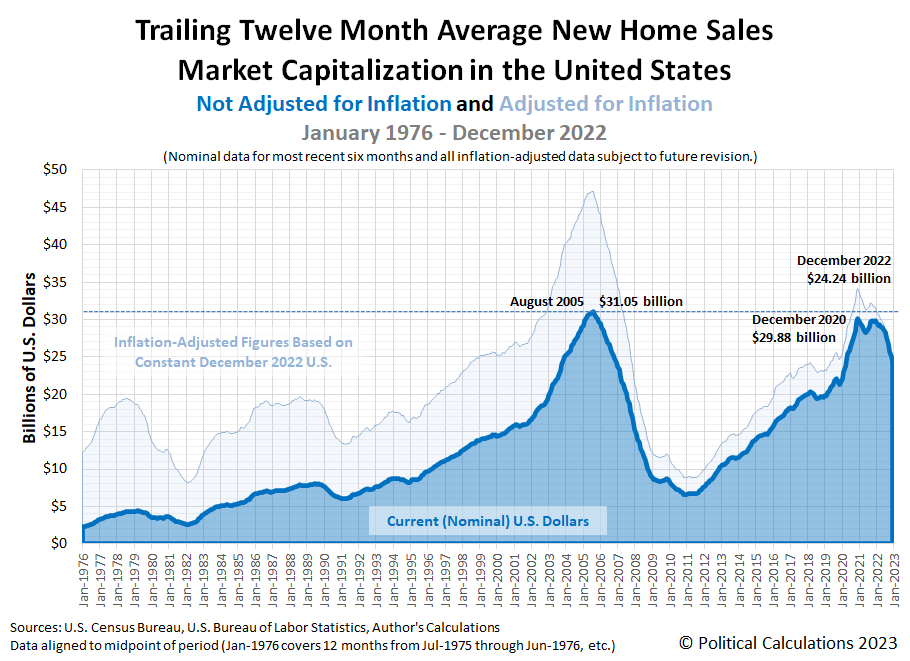
Political Calculations initial estimate of the market capitalization of the U.S. new home market is $24.24 billion in December 2022. That's 18.9% below the revised December 2020 peak of $29.88 billion, and month-over-month, represents a 3% reduction from November 2022's revised estimate of $24.99 billion (November 2022's initial estimate was $25.35 billion).
Here is the latest update to our chart illustrating the market capitalization of the new home market, which now covers 47 full years worth of monthly data from January 1976 through December 2022.
The following two charts show the latest changes in the trends for new home sales and prices:
Reuters misreads what's going on in the new home market:
Sales of new U.S. single-family homes increased for a third straight month in December as mortgage rates continued to decline, offering hope that the struggling housing market was starting to stabilize.
The problem with that assessment is that it only partially takes into account what's happening with how new home sales data from recent months is being revised. Since August 2022, the Census Bureau has been reporting substantial reductions in the number of sales with each revision. Here's is how these numbers have been changing each month, from initial through fourth estimate (these are seasonally adjusted annualized figures, indicating thousands of new homes sold):
- Aug 2022: 685, 677, 661, 646
- Sep 2022: 603, 588, 559, 550
- Oct 2022: 632, 605, 598
- Nov 2022: 640, 602
- Dec 2022: 616
The rightmost figures are either the final or most recent estimate. Based on this recent pattern for revisions, we anticipate December 2022's new sales total will be revised significantly lower than its initial estimate, almost certainly dropping it below the estimate for October 2022 and with a high probability of being reduced below November 2022's estimate.
Here's more from Reuters' report:
The Federal Reserve's fastest interest rate-hiking cycle since the 1980s has driven housing into recession. Falling mortgage rates have, however, raised hope that the housing market could soon stabilize, though at depressed levels.
The 30-year fixed mortgage rate declined to an average 6.15% last week, the lowest level since mid-September, according to data from mortgage finance agency Freddie Mac.
The rate was down form 6.33% in the prior week and has dropped from an average of 7.08% early in the fourth quarter, which was thi highest since 2002. But it remains well above the 3.56% average during the same period last year.
The median new house price in December was $442,100, a 7.8% increase from a year ago.
These figures refer to the raw figures provided in the U.S. Census Bureau's latest monthly report on new residential sales. That report also indicates the average new home sale price for December 2022 was $528,400.
References
U.S. Census Bureau. New Residential Sales Historical Data. Houses Sold. [Excel Spreadsheet]. Accessed 26 January 2023.
U.S. Census Bureau. New Residential Sales Historical Data. Median and Average Sale Price of Houses Sold. [Excel Spreadsheet]. Accessed 26 January 2023.
Labels: real estate
Welcome to the blogosphere's toolchest! Here, unlike other blogs dedicated to analyzing current events, we create easy-to-use, simple tools to do the math related to them so you can get in on the action too! If you would like to learn more about these tools, or if you would like to contribute ideas to develop for this blog, please e-mail us at:
ironman at politicalcalculations
Thanks in advance!
Closing values for previous trading day.
This site is primarily powered by:
CSS Validation
RSS Site Feed
JavaScript
The tools on this site are built using JavaScript. If you would like to learn more, one of the best free resources on the web is available at W3Schools.com.


