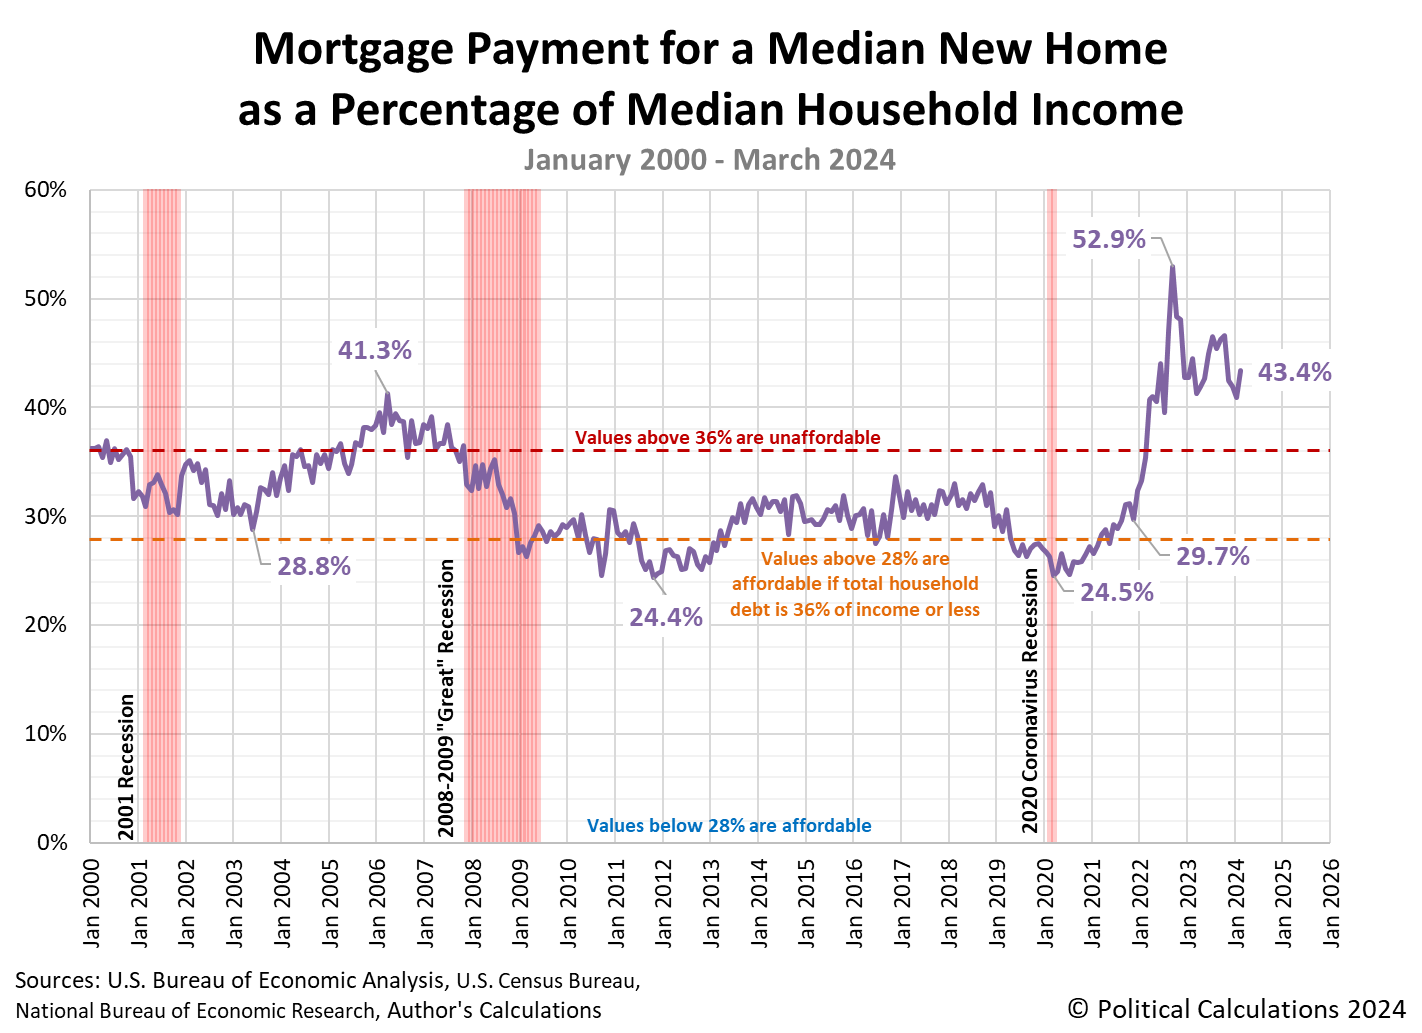
New homes in the U.S. became less affordable in March 2024. The median price of a new home sold rose to $430,700 and the average interest rate on a 30-year fixed rate conventional mortgage increased to 6.82% during the month. These two things together made the monthly payment on a new home less affordable than what it had been just a month earlier, which was already outside the threshold of affordability for the typical American household.
That's because the mortgage payment on a new home sold in March 2024 would consume 43.4% of the monthly income earned by an American household at the exact middle of the income spectrum in the United States. This measure of the relative affordability for a new home remains well above the 28% mortgage debt-to-income ratio and 36% total debt-to-income ratio thresholds that mortgage lenders set for borrowers to ensure they can afford their mortgage payments.
The mortgage payment for a median new home sold has consistently exceeded the 28% basic affordability threshold since February 2021 and the higher 36% affordability threshold since March 2022.
The following chart shows how the relative affordability of the typical new home sold in the U.S. has developed from January 2000 through March 2024.
The persistent inflation of new home prices that has taken place since February 2021 is changing the market for new homes:
The median new house price increased 6% to $430,700 from February. That was the highest level since last August. Prices, however, slipped 1.9% from a year ago. Most of the new homes sold last month were in the $300,000-$399,999 price range, followed by the $500,000-$749,000 price bracket.
Builders are constructing smaller and cheaper houses, but fewer of them are cutting prices. The NAHB survey last week showed the share of builders cutting prices fell to 22% in April from 24% in March and 36% in December. Fewer builders were also offering incentives to boost sales.
Overall house prices continue to rise because of the supply squeeze in the home resale market. Data from mortgage finance agency Fannie Mae last week showed house prices increased 7.4% on a year-on-year basis in the first quarter compared to a 6.6% rise in the fourth quarter. Fannie Mae upgraded its estimate for home price growth this year to 4.8% from 3.2% previously.
The resale market for existing homes has been devastated by the rise in interest rates that has taken place over this period. Many Americans households cannot afford to either buy or sell.
Something deeply unusual has happened in the American housing market over the last two years, as mortgage rates have risen to around 7 percent.
Rates that high are not, by themselves, historically remarkable. The trouble is that the average American household with a mortgage is sitting on a fixed rate that’s a whopping three points lower.
The gap that has jumped open between these two lines has created a nationwide lock-in effect — paralyzing people in homes they may wish to leave — on a scale not seen in decades. For homeowners not looking to move anytime soon, the low rates they secured during the pandemic will benefit them for years to come. But for many others, those rates have become a complication, disrupting both household decisions and the housing market as a whole.
Indeed, according to new research from economists at the Federal Housing Finance Agency, this lock-in effect is responsible for about 1.3 million fewer home sales in America during the run-up in rates from the spring of 2022 through the end of 2023. That’s a startling number in a nation where around five million homes sell annually in more normal times — most of those to people who already own.
Much of that pent up demand for housing has shifted to the new home market, which is preventing new home prices from falling to more affordable levels. It's a negative consequence from the interest rate hikes that have taken place to combat President Biden's inflation.
References
U.S. Census Bureau. New Residential Sales Historical Data. Houses Sold. [Excel Spreadsheet]. Accessed 23 April 2024.
U.S. Census Bureau. New Residential Sales Historical Data. Median and Average Sale Price of Houses Sold. [Excel Spreadsheet]. Accessed 23 April 2024.
Freddie Mac. 30-Year Fixed Rate Mortgages Since 1971. [Online Database]. Accessed 1 April 2024. Note: Starting from December 2022, the estimated monthly mortgage rate is taken as the average of weekly 30-year conventional mortgage rates recorded during the month.
Political Calculations. Median Household Income in March 2024. [Online article]. 1 May 2024.
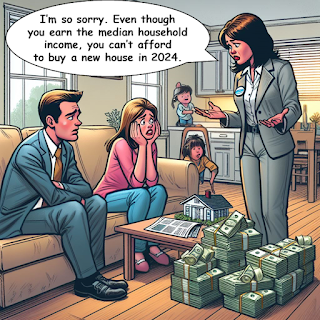
Image Credit: Microsoft Copilot Designer. Prompt: "An editorial cartoon of a young family realizing they cannot afford a new house with a real estate agent".
Labels: personal finance, real estate
Welcome to the blogosphere's toolchest! Here, unlike other blogs dedicated to analyzing current events, we create easy-to-use, simple tools to do the math related to them so you can get in on the action too! If you would like to learn more about these tools, or if you would like to contribute ideas to develop for this blog, please e-mail us at:
ironman at politicalcalculations
Thanks in advance!
Closing values for previous trading day.
This site is primarily powered by:
CSS Validation
RSS Site Feed
JavaScript
The tools on this site are built using JavaScript. If you would like to learn more, one of the best free resources on the web is available at W3Schools.com.

