The storm of anti-free trade policies resumed taking their toll on trade between the U.S. and China and also between the U.S. and the rest of the world in March 2024.
March 2024 saw the resumption of the United States' decline in trade with both China and the rest of the world. After hinting a month earlier that the decrease in goods exchanged between China and the world may have hit bottom, the U.S. Census' trade data for the value of goods both imported and exported to and from the U.S. indicates the bottom may not yet have been reached. Instead of continuing to rebound, March 2024 saw the combined value of traded goods reach new Biden-era lows.
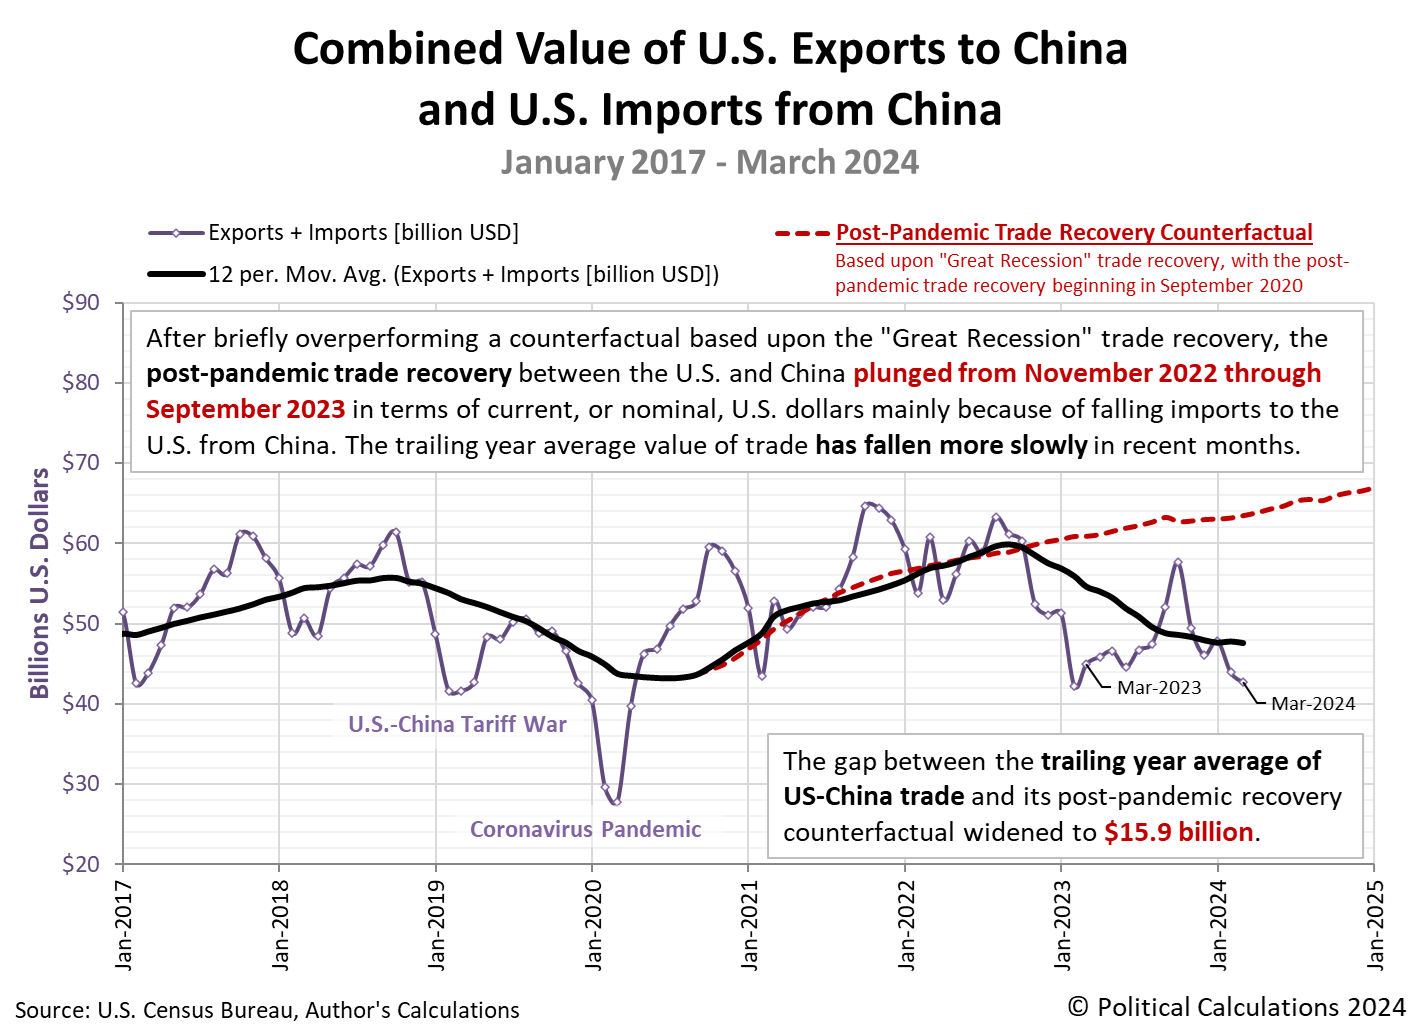
Starting with trade between the U.S. and China, we find the level of trade between the two countries dropped in March 2024, both month-over-month and year-over-year. The following chart confirms that change:
This chart also shows the rolling twelve month average of the combined value of goods traded between the two countries (the heavy black data series), which we use to monitor trends as it reduces the effects of seasonality in the raw monthly trade data (the purple data series). In March 2024, the downward trajectory of the trailing twelve month average fell below $47.6 billion, which is slightly below its January 2024 level and is also now the lowest point recorded since January 2021.
Meanwhile, the gap between the trailing year average of US-China trade and its post-pandemic recovery counterfactual grew to $15.9 billion. Since October 2022, the cumulative loss of trade between the U.S. and China has now grown to more than $173 billion.
October 2022 marked the start of a serious deterioration of trade between the two nations following President Biden's action to restrict the export of advanced semiconductor technology from the U.S. to China. The fallout from President Biden's anti-free trade policies has been worse than the losses that occurred during former President Trump's 2018 tariff war with China prior to the coronavirus pandemic's negative effect on trade.
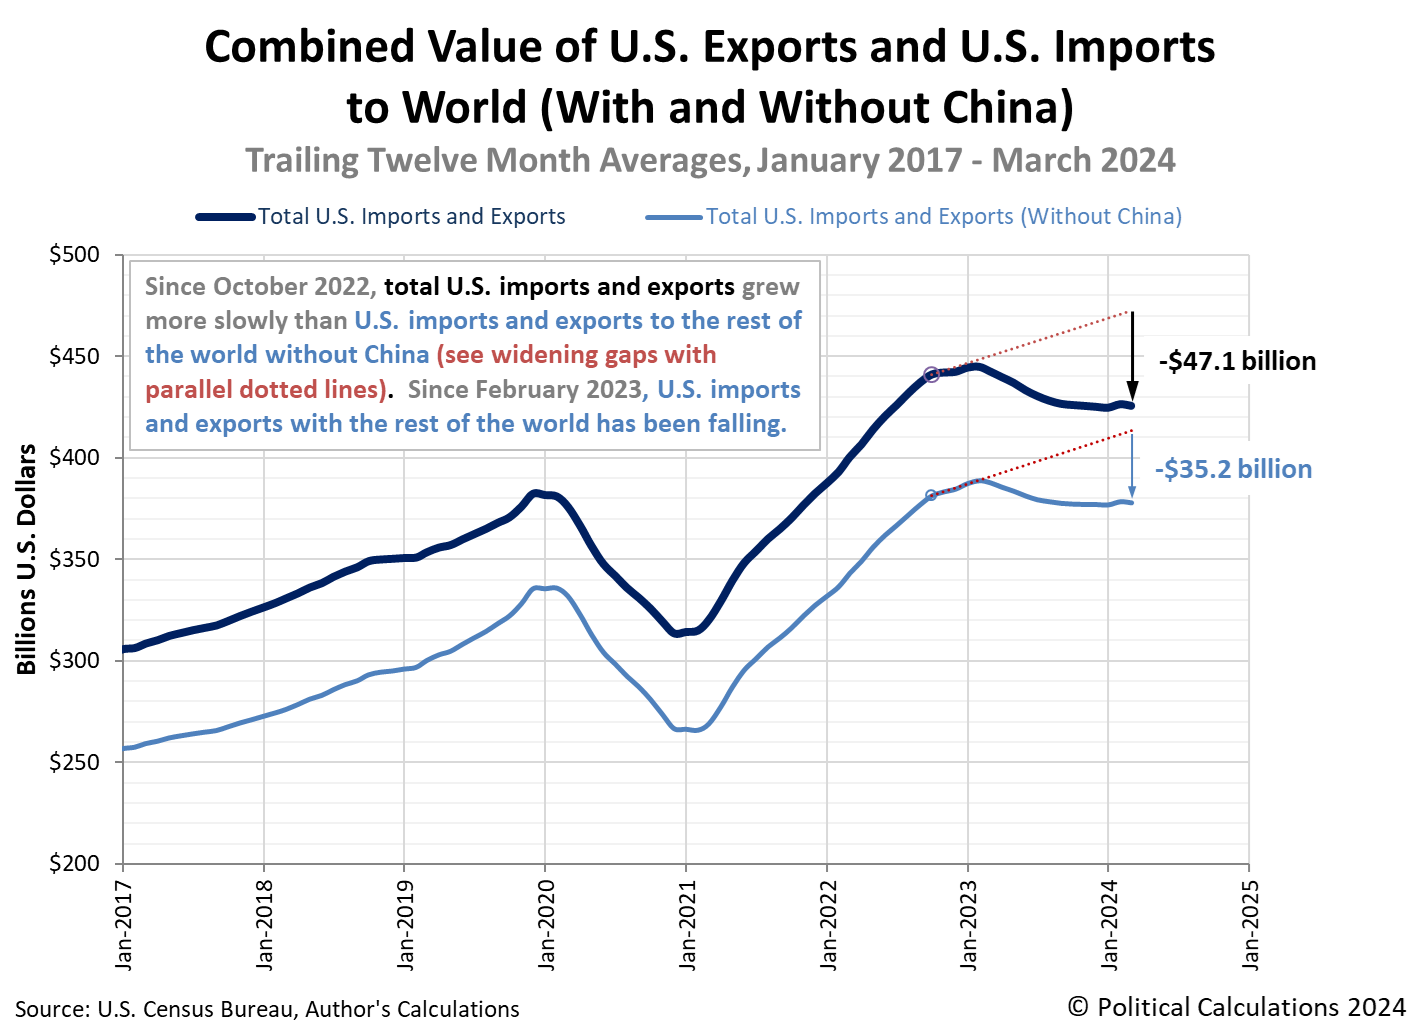
The Biden administration's anti-free trade policies have not been limited to trade with China. The next chart shows the United States' trade with the rest of the world has also deterioriated, although here, the beginning of the decline followed President Biden's 2023 State of the Union address, in which he announced expanded "Buy American" anti-free trade measures. That action has greatly diminished trade between the U.S. and its other trading partners, not just China. The next chart shows that level of trade dipped in March 2024, but not quite as low as its January 2024 low.
Since January 2023, the level of trade between the U.S. and the rest of the world has fallen $35.2 billion below its counterfactual, which assumes trade would have grown at the same rate it did from October 2022 through February 2023. Here, the cumulative decline in trade between the U.S. and the rest of the world since February 2023 has reached $286 billion.
References
U.S. Census Bureau. Trade in Goods with China. Last updated: 3 May 2024.
U.S. Census Bureau. Trade in Goods with World, Not Seasonally Adjusted. Last updated: 2 May 2024.
Image Credit: Microsoft Copilot Designer.. Prompt: "A photograph of a container ship sailing through stormy seas".
Labels: trade
Welcome to the blogosphere's toolchest! Here, unlike other blogs dedicated to analyzing current events, we create easy-to-use, simple tools to do the math related to them so you can get in on the action too! If you would like to learn more about these tools, or if you would like to contribute ideas to develop for this blog, please e-mail us at:
ironman at politicalcalculations
Thanks in advance!
Closing values for previous trading day.
This site is primarily powered by:
CSS Validation
RSS Site Feed
JavaScript
The tools on this site are built using JavaScript. If you would like to learn more, one of the best free resources on the web is available at W3Schools.com.


