How badly are the lowest-paid wage earners doing in the U.S.? That's a question that we thought we'd ask after looking at the distribution of hourly wage earners in the United States last week. Fortunately, it turned out to be a relatively easy question to answer, since the Congressional Budget Office had already done the work for us!
The following figure, taken from the CBO's December 2006 report Changes in Low-Wage Labor Markets Between 1979 and 2005 shows the inflation-adjusted hourly wage being paid the lowest 1/10th (10th percentile) and lowest 1/5th (20th percentile) of hourly wage earners from 1979 through 2005. We've modified the chart by adding the gray lines to better show the difference in comparable hourly wage for each year since 1979 for each percentile group, and we've also added the hourly wage on the right to show the hourly wage percentile threshholds for 2005:
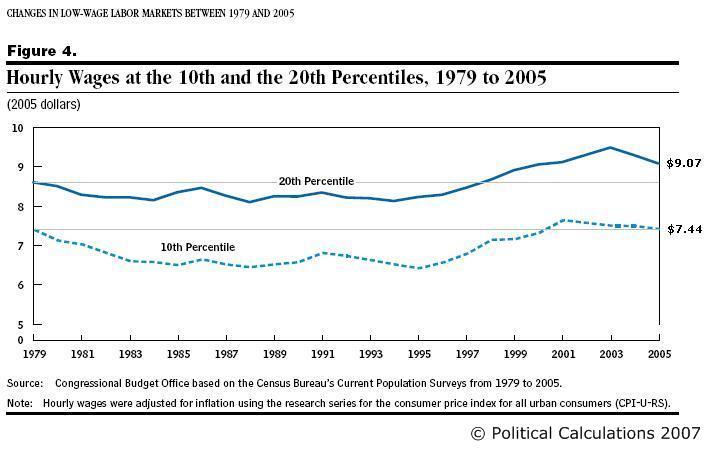
The chart reveals that, after adjusting for inflation, the hourly wages earned by the lowest 10% of U.S. hourly-wage earners in 2005 is nearly equivalent to what the lowest 10% of U.S. hourly-wage earners made per hour in 1979 - earning $7.44 per hour or less in 2005 while earning $7.43 per hour or less in 1979. More remarkably, it has only been since 2000 that the lowest 10% of wage earners have been paid above the equivalent 1979 hourly wage!
Meanwhile, the lowest 20% of U.S. hourly wage earners in 2005 has clearly come out ahead compared to their 1979 counterparts. Here, inflation-adjusted hourly wages have grown from roughly $8.60 in 1979 to $9.07 per hour in 2005, a comparative 5.5% increase. Here, the chart indicates that the lowest 20% of U.S. hourly wage earners have been ahead of their 1979 counterparts since 1998.
As the chart clearly indicates, the inequality in hourly wages earned by the lowest 10% of U.S. hourly wage earners and the lowest 20% of U.S. wage earners has grown substantially since 1979. While those in the lowest 10% in 2005 are roughly equivalent to slightly ahead their equivalent wage-earning peers of 1979, those in the lowest 20% of wage-earners have substantially increased their relative position above the lowest 10% of wage-earners over the same period of time.
Our question for the new Congressional majority: why is this growth in income inequality a bad thing? Or rather, what advantage is there in rigidly dividing U.S. wage earners into strata that never change with time?
Labels: income inequality, minimum wage, wages
Welcome to the blogosphere's toolchest! Here, unlike other blogs dedicated to analyzing current events, we create easy-to-use, simple tools to do the math related to them so you can get in on the action too! If you would like to learn more about these tools, or if you would like to contribute ideas to develop for this blog, please e-mail us at:
ironman at politicalcalculations
Thanks in advance!
Closing values for previous trading day.
This site is primarily powered by:
CSS Validation

RSS Site Feed
JavaScript
The tools on this site are built using JavaScript. If you would like to learn more, one of the best free resources on the web is available at W3Schools.com.
Other Cool Resources
Blog Roll


