It doesn't happen often, but sometimes, we find ourselves almost perfectly situated to capture two snapshots in time for the S&P 500 (Index: SPX).
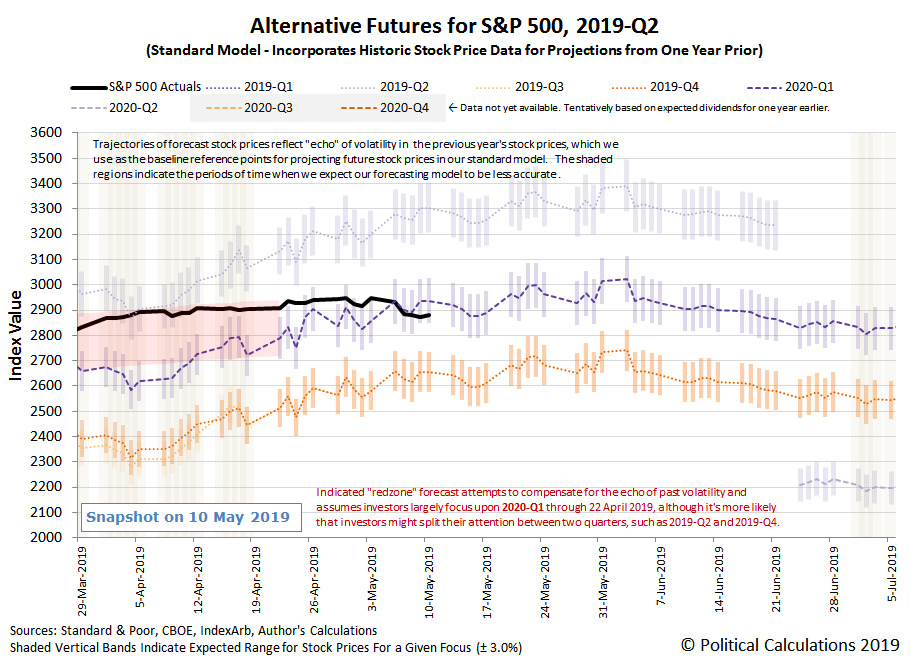
We presented the first snapshot in time early in the morning of Monday, 13 May 2019, where we summed up what had happened to S&P 500 as it had been "knocked about by noisy U.S.-China trade negotiations" during the trading week ending on 10 May 2019 with just two charts and two paragraphs:
The S&P 500 (Index: SPX) set no new records during the week of trading ending on Friday, 10 May 2019, where stock prices mostly appeared to react to the noise generated by trade negotiations between the United States and China.
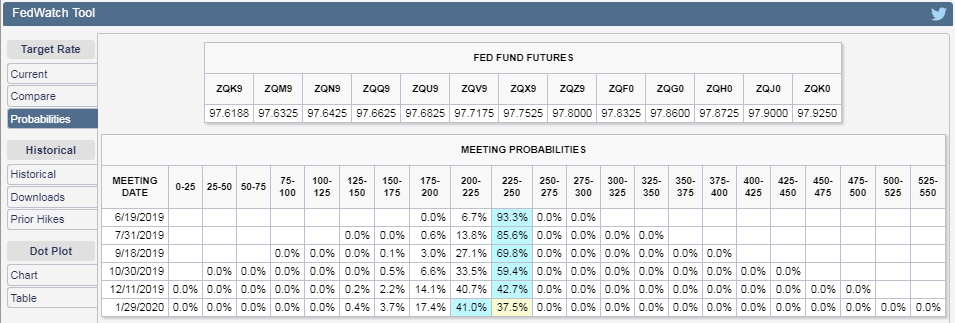
Overall, the index stayed within the typical range of values our dividend futures-based model would project if investors were primarily focused on the distant future quarter of 2020-Q1. Not uncoincidentally, this period coincides with the expectation that the Fed will next act to cut its Federal Funds Rate during that quarter, according to the latest probabilities indicated by the CME Group’s Fedwatch Tool.
The second snapshot in time comes from the end of trading on Monday, 13 May 2019, when after having been triggered by China's new retaliatory tariffs, investors responded by shifting a portion of their forward-looking focus from 2020-Q1 back toward the nearer-term future of 2019-Q4 and the more negative expectations associated with that point of time in the future. For our dividend futures-based model of how stock prices work, that shift in how far forward investors are looking was sufficient to send the S&P 500 sinking.
Having dropped below the range we would expect the S&P 500 to be if investors were focusing on 2020-Q1 in setting current day stock prices, or rather, the expectations for dividend growth that are associated with that distant future quarter, we would describe the current level of the S&P 500 as being consistent with investors splitting their attention between 2018-Q4 and 2020-Q1.
Not uncoincidentally, the sudden shift toward the earlier quarter of 2018-Q4 coincides with the heightened expectation that the Fed will next act to cut its Federal Funds Rate during that quarter, according to the latest probabilities indicated by the CME Group’s Fedwatch Tool. The following image shows how those probabilities have changed during the course of just one trading day:
As for why investors would suddenly be betting on the Fed cutting short term U.S. interest rates sooner rather than later, the Fed's minions have been priming their expectations for what they would do if the U.S.-China trade war slows the U.S. economy. Here's a sampling of relevant headlines since Thursday, 9 May 2019:
- Fed's Bostic says scheduled tariff hike could fuel inflation
- Tariff tumult boosts view that Fed may cut U.S. rates
- Fed's Bostic says tariff hikes could prompt rate cut if consumers pull back
- Fed can lower rates if U.S.-China trade spat causes slowdown: Rosengren
Now the question is will something happen to shift their attention back toward 2020-Q1 and prompt a rebound in stock prices? Or will they come to more closely focus upon 2019-Q4 and potentially send the S&P 500 down even more? If you can predict which point in time will come to capture the attention of today's investors and can set up your investing strategy accordingly, you could stand to benefit from what a behavioral finance expert like Robert Shiller might call irrational behavior, but which is really anything but.
Welcome to the blogosphere's toolchest! Here, unlike other blogs dedicated to analyzing current events, we create easy-to-use, simple tools to do the math related to them so you can get in on the action too! If you would like to learn more about these tools, or if you would like to contribute ideas to develop for this blog, please e-mail us at:
ironman at politicalcalculations
Thanks in advance!
Closing values for previous trading day.
This site is primarily powered by:
CSS Validation
RSS Site Feed
JavaScript
The tools on this site are built using JavaScript. If you would like to learn more, one of the best free resources on the web is available at W3Schools.com.


