It's not often we can use math to definitively shut down a claim being made to pitch an investment, but here we are.
The pitch involves the cryptocurrency Bitcoin (BTC). The claim, most famously made by the Winklevoss brothers in 2017, is that "Bitcoin is Gold 2.0". Here's a more recent clip of the brothers repeating their pitch on CNBC on 10 July 2019:
While they may be among the most prominent pitchmen for Bitcoin, they're far from alone in claiming Bitcoin has gold-like investing properties. Here's a selection of articles we turned up from 2013 through 2022 where analysts have made similar claims:
- 29 April 2013: BitCoin Is Gold 2.0: Venture Capitalist
- 11 April 2016: Can Bitcoin Be Gold 2.0?
- 10 December 2020: Why Bitcoin is Gold 2.0
- 1 January 2021: Billionaire bitcoin proponents make play for gold 2.0
- 24 December 2021: Bitcoin is Gold 2.0. It Fixes Inflation And Good ROI Too
- 3 January 2022: Bitcoin is ‘gold 2.0’ and will hit ‘$100k’ this year’, Nexo founder reiterates
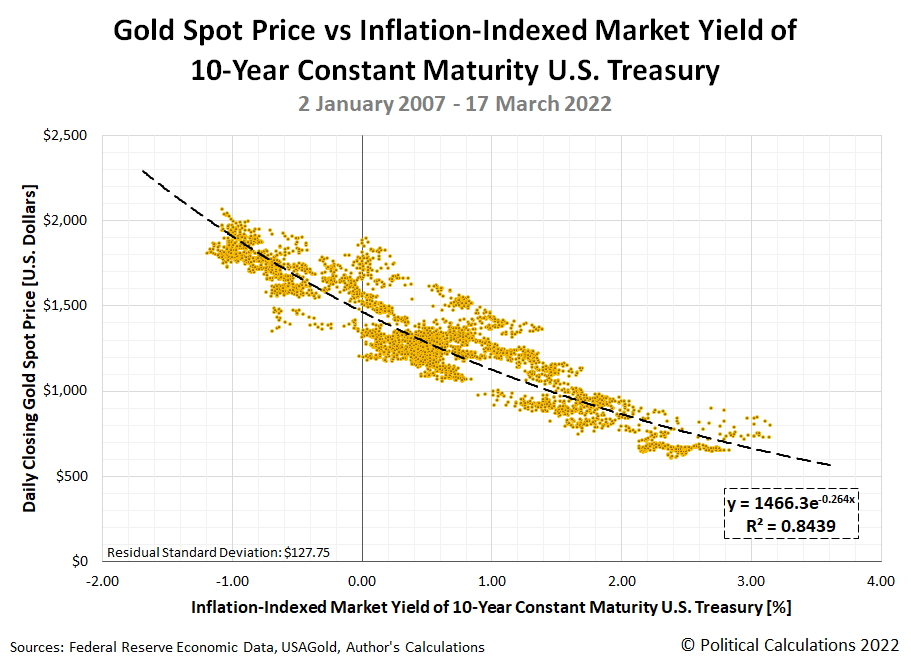
Let's address the elephant in the room. For Bitcoin to be Gold 2.0, it needs to share gold's top investing characteristic: it needs to provide an effective hedge against inflation by rising in value as inflation reduces real yields. Gold, or as BTC enthusiasts would describe it, Gold 1.0, does exactly that when real interest rates fall and become negative as the rate of inflation grows to exceed nominal interest rates. Here's the chart we featured in previous analysis showing the price of gold doing just that, rising in value as real interest rates decline in value and vice versa.
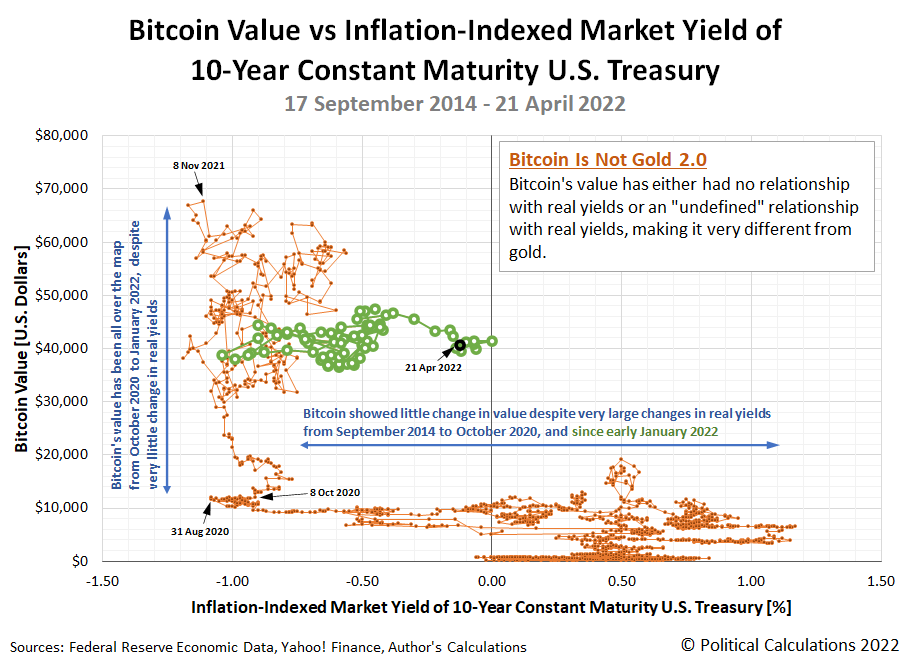
Now, here's a chart that presents the value of Bitcoin with respect to the same data for the inflation-adjusted yields of 10-year Constant Maturity U.S. Treasuries over the period from 17 September 2014 through 21 April 2022, covering nearly the entire period where we can identify that the claim that "Bitcoin is Gold 2.0" has been prominently made. Spoiler alert: Bitcoin is not Gold 2.0!
The chart of Bitcoin's "relationship" with real yields looks like something that could have been created on an Etch-a-Sketch. The value of BTC either moves sideways or up-and-down.
That observation aside, we see three main periods for Bitcoin's valuation history in this chart:
- 17 September 2014 to 7 October 2020. The price of Bitcoin in U.S. dollars has virtually no relationship with real interest rates, despite substantial changes in their value during this period. In math terms, the slope of the trendlines whenever real interest rates are changing in value is nearly equal to zero, because the value of Bitcoin isn't changing with them.
- 8 October 2020 - 6 January 2022. This is the period when the biggest changes in the valuation of Bitcoin has occurred, and we find that while Bitcoin's value has ranged all over the map from nearly $11,000 to a peak of $67,567 during this second period, it's matched against very little change in real interest rates. In math terms, the effectively vertical movement in Bitcoin's valuation is not defined with respect to changes in real interest rates. In practical terms, whatever moved Bitcoin prices during this time was unconnected to how inflation affected interest rates.
- 7 January 2022 - 21 April 2022. Shown as the green circles on the chart, we find once again there is little change in the value of Bitcoin even though real interest rates have substantially changed. Just like in the first period, the value of Bitcoin shows little to no, or dare we say, zero connection to changes in real interest rates.
For the record, we're just the latest to conclude that Bitcoin is not Gold 2.0, though perhaps the first to show it using tools available to middle and high school algebra students. Here is other analysis that finds Bitcoin lacks gold's most attractive investing properties for extra credit reading:
- 1 October 2018: Bitcoin is not the New Gold - A comparison of volatility, correlation, and portfolio performance
- 15 May 2019: Why Bitcoin Isn’t Gold 2.0
- 16 March 2020: Bitcoin Is Not Like Gold
- 15 April 2021: Ten Years And $1 Trillion Later, Bitcoin’s Still Nothing Like Gold
With respect to changes in inflation-adjusted interest rates, we've demonstrated the value of Bitcoin either moves sideways or up-and-down with little rhyme or reason, making it very different from how gold has performed during the period of their shared existence. Bitcoin is not Gold 2.0.
Previously on Political Calculations
References
Federal Reserve Economic Data. Market Yield on U.S. Treasury Securities at 10-Year Constant Maturity, Inflation-Indexed. [Online Database (Text File)]. Accessed 22 April 2022.
Yahoo! Finance. Bitcoin USD (BTC-USD), 14 September 2014 through 21 April 2022. [Online Database]. Accessed 22 April 2022.
Labels: data visualization, inflation, investing
Welcome to the blogosphere's toolchest! Here, unlike other blogs dedicated to analyzing current events, we create easy-to-use, simple tools to do the math related to them so you can get in on the action too! If you would like to learn more about these tools, or if you would like to contribute ideas to develop for this blog, please e-mail us at:
ironman at politicalcalculations
Thanks in advance!
Closing values for previous trading day.
This site is primarily powered by:
CSS Validation
RSS Site Feed
JavaScript
The tools on this site are built using JavaScript. If you would like to learn more, one of the best free resources on the web is available at W3Schools.com.

