February 2023 saw the market capitalization of new homes sold in the U.S. rise for the first time in eleven months. A combination of a higher number of new homes sold and a small increase in the average sale price of new homes sold contributed to the first increase in this measure since March 2022.
While these changes are based on preliminary estimates, they do confirm the change in momentum observed a month earlier. In January 2023, the decline in the market cap of new homes sold slowed for the first time in months. The new data indicates positive momentum building in the market, which in turn helps explain why U.S. homebuilders were becoming more optimistic last month.
Much of that optimism is tied to the direction of mortgage rates, which fell in February 2023, helping make new homes more affordable. We'll take a closer look at the trends for the affordability of new homes sometime in the next week, but for now, here's the latest update to the big picture for new home builders and the U.S. economy.
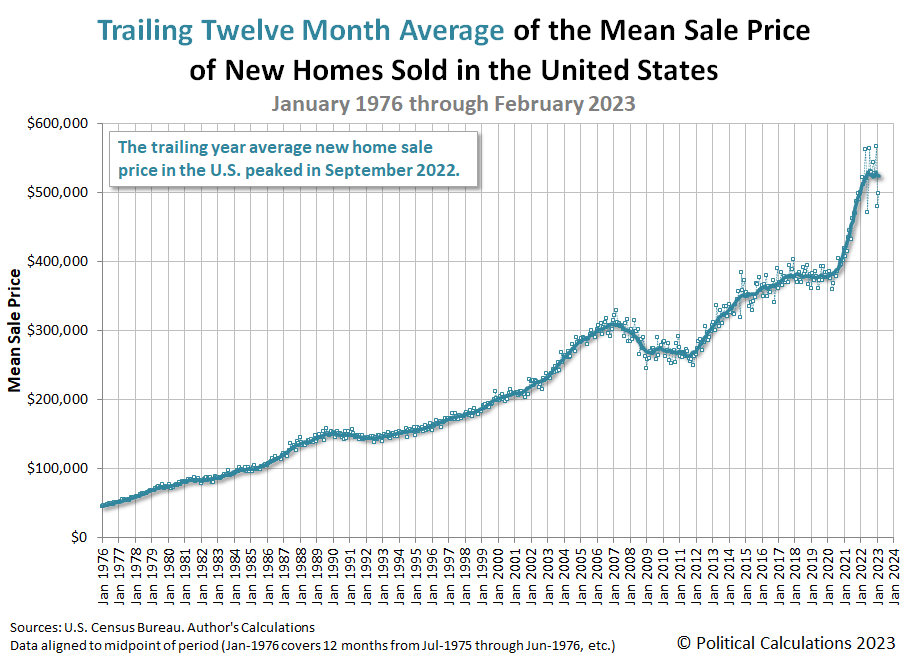
This chart shows the time-shifted rolling twelve month average of the U.S. new home market capitalization for February 2023 is $25.41 billion. That figure represents a small increase from January 2023's revised $25.34 billion. The following two charts show the latest changes in the trends for new home sales and prices:
The question for new home builders is whether this positive momentum can overcome the negative conditions that are developing in the U.S. economy. We anticipate it will continue in March 2023, but what happens after the first quarter of 2023 ends will hinge on other economic factors.
References
U.S. Census Bureau. New Residential Sales Historical Data. Houses Sold. [Excel Spreadsheet]. Accessed 23 March 2023.
U.S. Census Bureau. New Residential Sales Historical Data. Median and Average Sale Price of Houses Sold. [Excel Spreadsheet]. Accessed 23 March 2023.
Image credit: U.S. Census Bureau: New Single-Family Homes Sold Not as Large as They Used to Be.
Labels: real estate
Welcome to the blogosphere's toolchest! Here, unlike other blogs dedicated to analyzing current events, we create easy-to-use, simple tools to do the math related to them so you can get in on the action too! If you would like to learn more about these tools, or if you would like to contribute ideas to develop for this blog, please e-mail us at:
ironman at politicalcalculations
Thanks in advance!
Closing values for previous trading day.
This site is primarily powered by:
CSS Validation
RSS Site Feed
JavaScript
The tools on this site are built using JavaScript. If you would like to learn more, one of the best free resources on the web is available at W3Schools.com.


