How long does excess CO₂ stay in the atmosphere?
That question is surprisingly difficult to answer, because unlike greenhouse gases like methane (11.8 years) or nitrous oxide (109 years), climate scientists say there are multiple answers to it. Those answers include ones that apply when the cumulative accumulation of carbon dioxide in the atmosphere is low, as in the past-to-present period, or when the accumulation of CO₂ in the air reaches the much higher levels they project in the future.
And then there's the complexity of the carbon cycle itself. Some parts of that process start almost immediately. Other parts take place over decades, if not centuries. And that's before we get to the geological processes that take millennia!
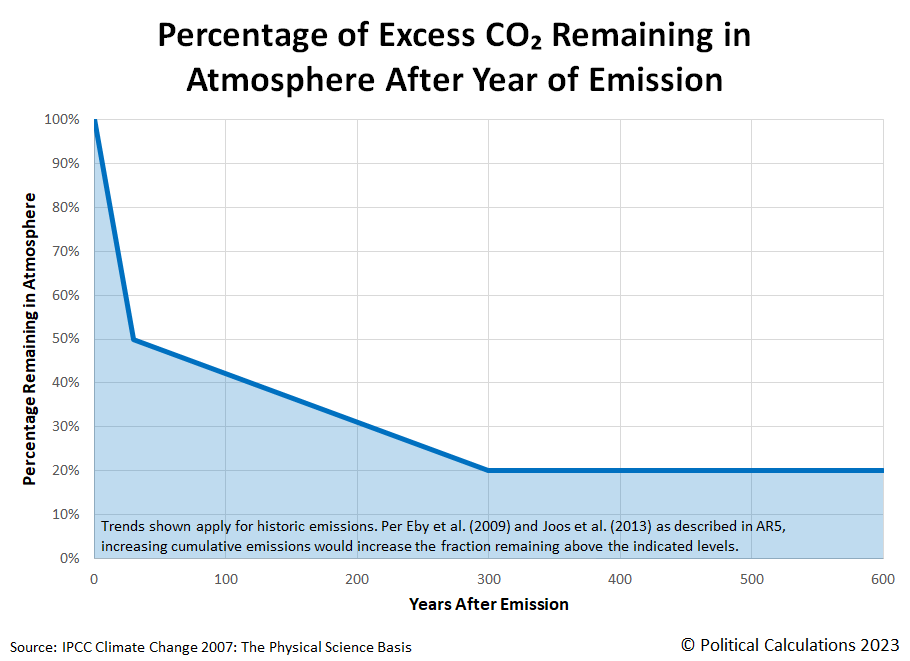
Because we have an upcoming project that focuses on the past-to-present period, we've put together the following chart and tool to estimate how much of a given year's excess carbon dioxide emissions remain after a given number of years. Here's the chart, which is based on estimates published by the Intergovernmental Panel on Climate Change (IPCC) in 2007.
Here's the description of what the chart is illustrating:
Carbon dioxide cycles between the atmosphere, oceans and land biosphere. Its removal from the atmosphere involves a range of processes with different time scales. About 50% of a CO₂ increase will be removed from the atmosphere within 30 years, and a further 30% will be removed within a few centuries. The remaining 20% may stay in the atmosphere for many thousands of years.
Later findings from May 2009 indicate the drawdown of excess CO₂ "is accurate for relatively small amounts of emissions at the present time", which in May 2009, meant an average atmospheric concentration of 390.36 parts per million. Fourteen years later, the average atmospheric concentration of CO₂ measured at the Mauna Loa Observatory increased by less than 9%, so we'll assume the math done by the tool below based on the absorption of CO₂ by plants and the ocean is still very reasonably close to accurate.
Here's the tool, where you can find out what percent of the excess CO₂ emissions from a past year might still be left in the air after the elapsed number of years you enter. If you're accessing this article on a site that republishes our RSS news feed, please click through to our site to access a working version.
In the tool and chart, we've arbitrarily capped the number of years to estimate the percentage carbon dioxide remaining at 600 years. That's actually more twice as long as we need for an upcoming project where we'll make use of the math behind this tool. Seeing as there are fewer than 300 years of excess carbon dioxide emission generation that are attributable to large-scale human industrial processes, we don't need more than that!
References
Presented in reverse chronological order. We had to daisy chain through multiple references to arrive at the estimates we presented above and verify their applicability to historic data.
NASA. Global Climate Change. Graphic: Major Greenhouse Gas Sources, Lifespans, and Possible Added Heat. Online Article. 22 June 2023.
Forster, P., T. Storelvmo, K. Armour, W. Collins, J.-L. Dufresne, D. Frame, D.J. Lunt, T. Mauritsen, M.D. Palmer, M. Watanabe, M. Wild, and H. Zhang, 2021: The Earth’s Energy Budget, Climate Feedbacks, and Climate Sensitivity. In Climate Change 2021: The Physical Science Basis. Contribution of Working Group I to the Sixth Assessment Report of the Intergovernmental Panel on Climate Change [Masson-Delmotte, V., P. Zhai, A. Pirani, S.L. Connors, C. Péan, S. Berger, N. Caud, Y. Chen, L. Goldfarb, M.I. Gomis, M. Huang, K. Leitzell, E. Lonnoy, J.B.R. Matthews, T.K. Maycock, T. Waterfield, O. Yelekçi, R. Yu, and B. Zhou (eds.)]. Cambridge University Press, Cambridge, United Kingdom and New York, NY, USA, pp. 923–1054, doi:. 923–1054. [PDF Document]. DOI: 10.1017/9781009157896.009.
Stocker, B., Roth, R., Joos, F. et al. Multiple greenhouse-gas feedbacks from the land biosphere under future climate change scenarios. Nature Clim Change 3, 666–672 (2013). DOI: 10.1038/nclimate1864.
M. Eby, K. Zickfeld, A. Montenegro, D. Archer, K. J. Meissner, and A. J. Weaver. Lifetime of Anthropogenic Climate Change: Millennial Time Scales of Potential CO₂ and Surface Temperature Perturbations. Journal of Climate, Volume 22. 15 May 2009. 2501-2511. [Ungated PDF Document]. DOI: 10.1175/2008JCLI2554.1.
Archer, D., Brovkin, V. The millennial atmospheric lifetime of anthropogenic CO2. Climatic Change 90, 283–297 (2008). [PDF Document]. DOI: 10.1007/s10584-008-9413-1.
Moore, Lisa. Greenhouse Gases: How Long Will They Last? Environmental Defense Fund Climate 411 Blog. [Online Article]. 26 February 2008.
Denman, K. L., and Coauthors, 2007: Couplings between changes in the climate system and biogeochemistry. Climate Change 2007: The Physical Science Basis, S. Solomon et al., Eds., Cambridge University Press, 589–662. [PDF Document]. DOI: 10.1080/03736245.2010.480842.
Image credit: Demonstrative example of Carbon Cycle by U.S. Department of Energy Biological and Environmental Research Information System via Wikimedia Commons. Public Domain.
Labels: environment, tool
Welcome to the blogosphere's toolchest! Here, unlike other blogs dedicated to analyzing current events, we create easy-to-use, simple tools to do the math related to them so you can get in on the action too! If you would like to learn more about these tools, or if you would like to contribute ideas to develop for this blog, please e-mail us at:
ironman at politicalcalculations
Thanks in advance!
Closing values for previous trading day.
This site is primarily powered by:
CSS Validation
RSS Site Feed
JavaScript
The tools on this site are built using JavaScript. If you would like to learn more, one of the best free resources on the web is available at W3Schools.com.

