It happened again in February 2024. The size of the U.S. new home market as measured by its market capitalization shrank for the fifth month in a row.
Political Calculations' initial estimate of the size of the new home market cap in February 2024 is $26.38 billion. This estimate is nearly 7% below September 2023's now finalized estimate of $28.34 billion. It is also 12.5% below the December 2020 post-housing bubble peak of $30.12 billion.
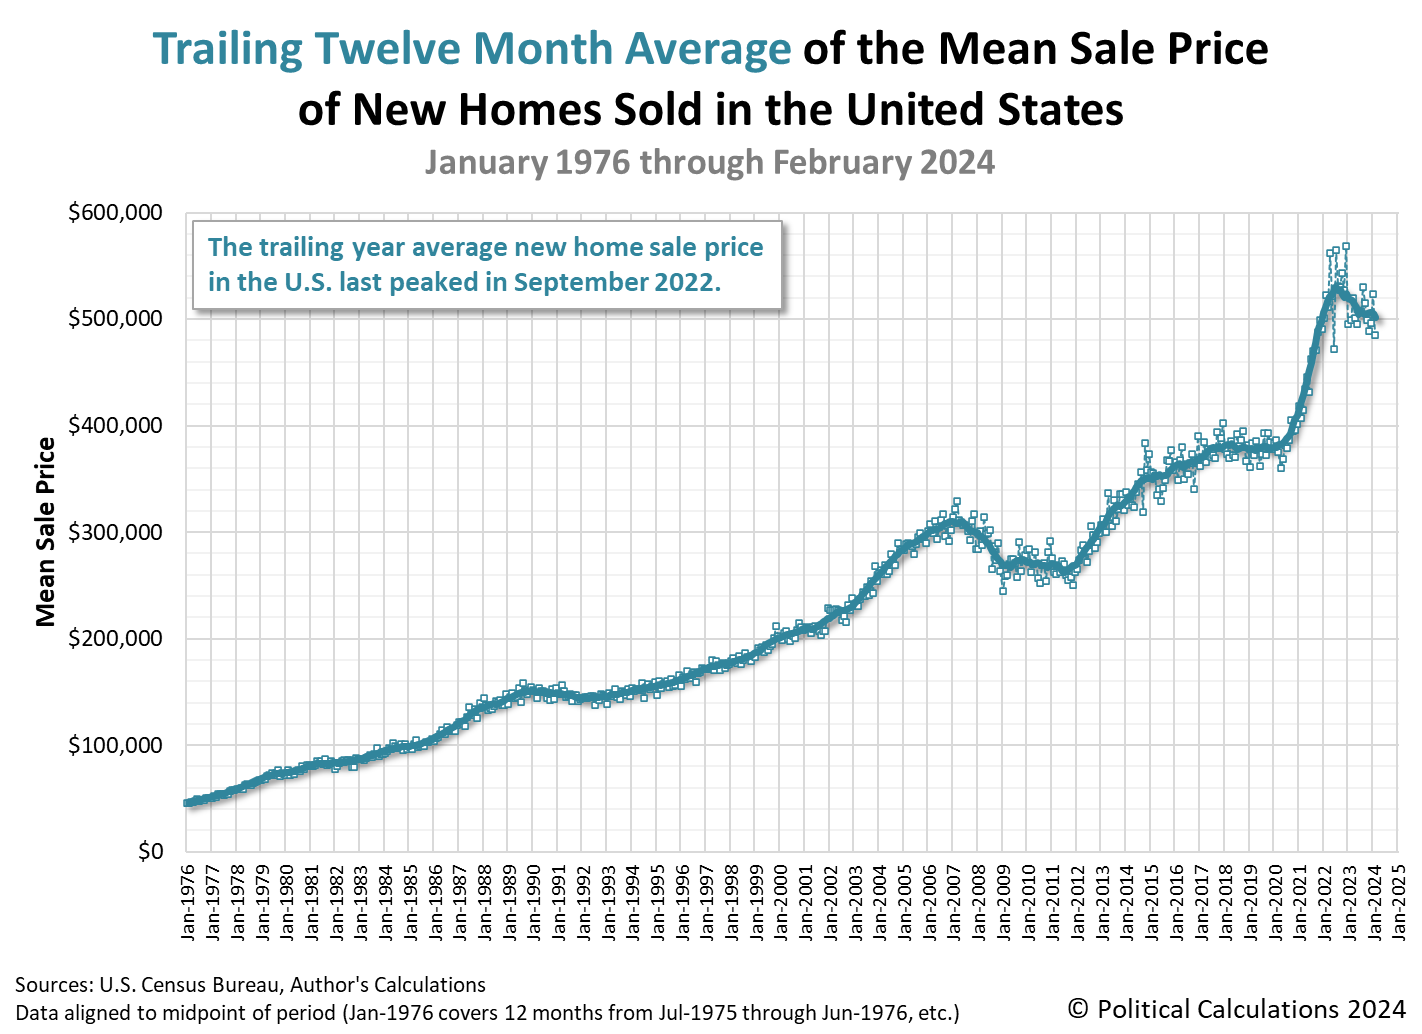
The average price of a new home sold in February 2024 declined month-over-month. The U.S. Census Bureau's initial estimate of the average price for a new home sold in February 2024 is $485,000. This average price came in well below January 2024's revised estimate of $523,400, which itself was reduced from a first estimate of $534,300.
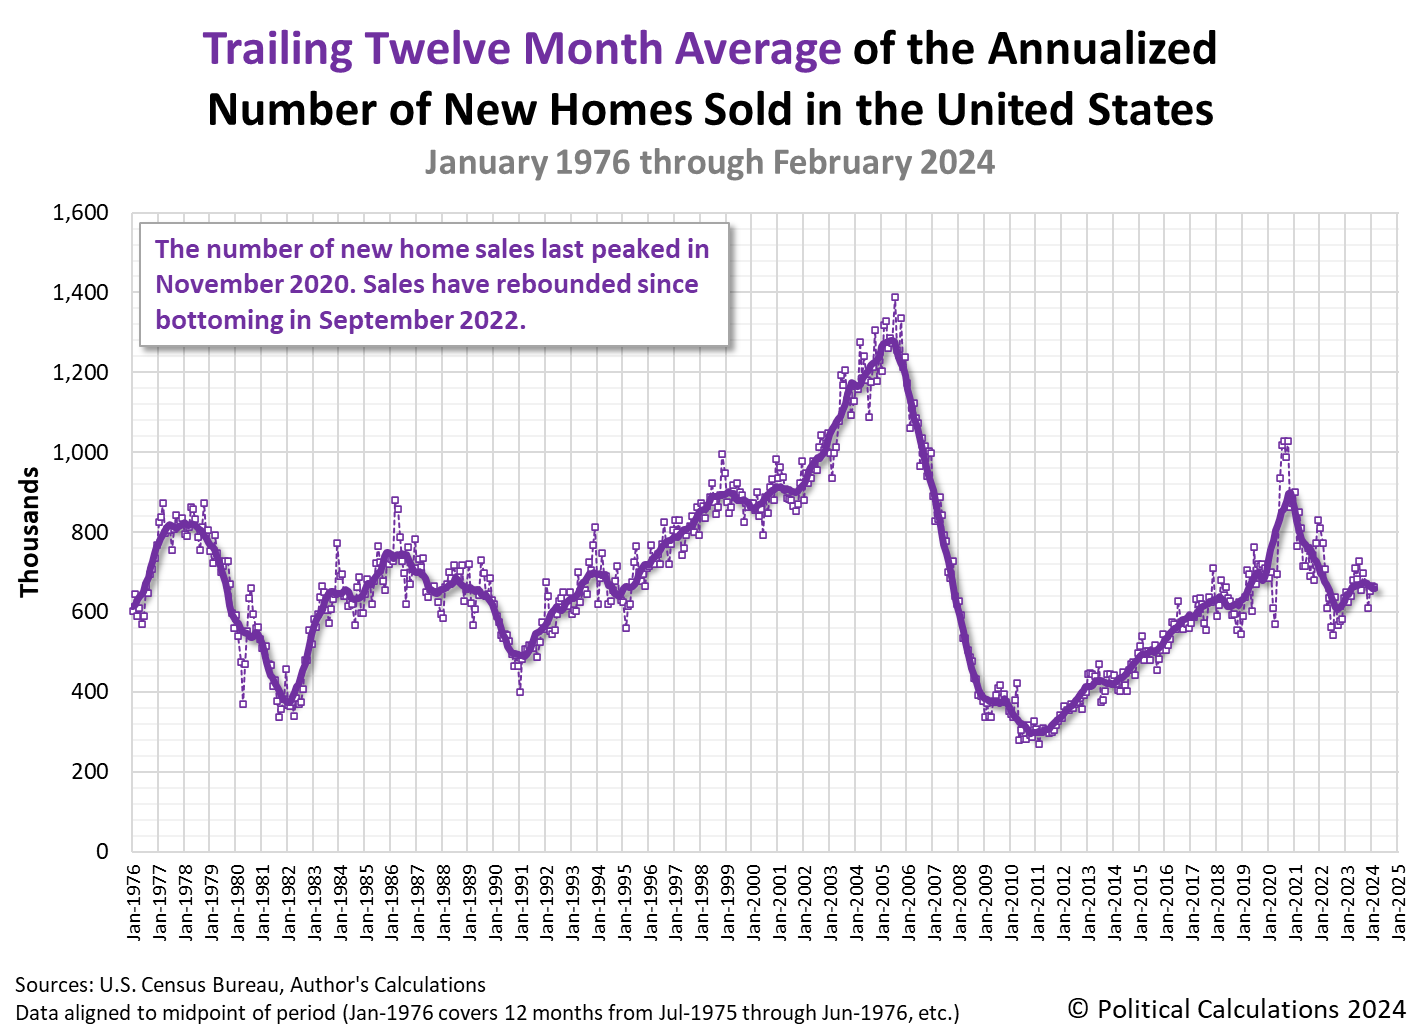
Meanwhile, the estimated number of new homes sold saw a small increase from January to February 2024. The first estimate of the seasonally-adjusted annualized number of new homes sold in February 2024 is 662,000, just 2,000 less than the preceding month's upwardly revised total of 664,000.
That small decrease in sales combined with the much larger decline in sale prices to cause the new home market cap to fall for the fifth consecutive month. The following charts show the evolution of the U.S. new home market capitalization, the number of new home sales, and also new home sale prices as measured by their time-shifted, trailing twelve month averages from January 1976 through February 2024.
Some market observers strained to find a silver lining in these gloomy numbers.
Sales of new U.S. single-family homes unexpectedly fell in February after mortgage rates increased during the month, but the underlying trend remained strong amid a chronic shortage of previously owned houses on the market.
The report from the Commerce Department on Monday also showed the median new house price last month was the lowest in more than 2-1/2 years, while supply was the highest since November 2022. Builders are ramping up construction, while offering price cuts and other incentives as well as reducing floor size to make housing more affordable.
"Housing activity is stabilizing as homebuilders appear to be building cheaper, and therefore, likely smaller homes," said Conrad DeQuadros, senior economic advisor at Brean Capital. "Sales have been relatively stable at December's level over the last two months and prices have been falling at mid-single-digit rates on a year-over-year basis."...
The overall housing market has likely turned the corner, with home resales surging to a one-year high in February. Nonetheless, supply remains inadequate, keeping house prices elevated and homeownership out of the reach of many.
We'll take a separate look at the relative affordability of new homes sold in February 2024 in the near future.
References
U.S. Census Bureau. New Residential Sales Historical Data. Houses Sold. [Excel Spreadsheet]. Accessed 25 March 2024.
U.S. Census Bureau. New Residential Sales Historical Data. Median and Average Sale Price of Houses Sold. [Excel Spreadsheet]. Accessed 25 March 2024.
Image credit: New Home Construction photo by Paul Brennan on PublicDomainPictures. Creative Commons CC0 1.0 Deed.
Labels: market cap, real estate
Welcome to the blogosphere's toolchest! Here, unlike other blogs dedicated to analyzing current events, we create easy-to-use, simple tools to do the math related to them so you can get in on the action too! If you would like to learn more about these tools, or if you would like to contribute ideas to develop for this blog, please e-mail us at:
ironman at politicalcalculations
Thanks in advance!
Closing values for previous trading day.
This site is primarily powered by:
CSS Validation
RSS Site Feed
JavaScript
The tools on this site are built using JavaScript. If you would like to learn more, one of the best free resources on the web is available at W3Schools.com.


