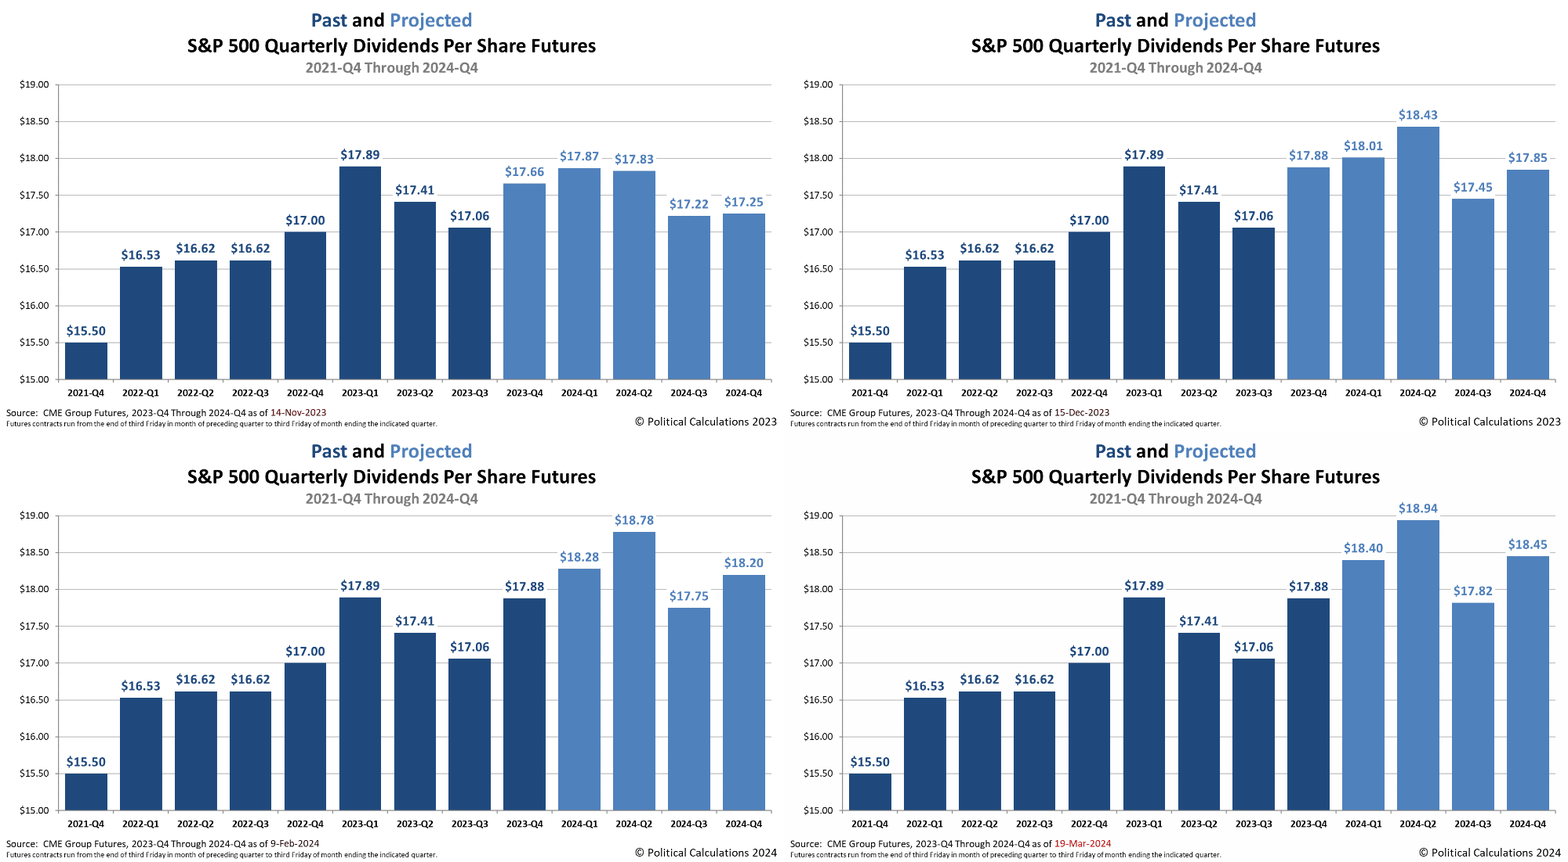
If you want to explain why the S&P 500 has been rising, you don't have to look far beyond how the expectations investors have for the index' dividends have been changing over the last several months.
We last presented our regularly scheduled winter snapshot of the expected future for the quarterly dividend payouts for the S&P 500 (Index: SPX) just under six weeks ago. Within those six weeks, the outlook for the index' dividends has continued to improve. With that fundamental underlying support, it's no wonder the index has been recording a series of new record highs.
The developing trend is such that if it continues, we'll have to modify the vertical scale of our chart when we take our regularly scheduled Spring 2024 snapshot of the S&P 500's dividend outlook about six weeks from now.
In the following animated chart, we show how much the expectations for the S&P 500's dividends have changed for each future quarter of 2024. The chart presents both historic (darker blue) and projected (lighter blue) dividend futures data for the S&P 500 from CME Group for the period from 2021-Q4 through 2024-Q4 at various snapshots we've taken between 14 November 2023 and 19 March 2024.
In this animated bar chart, while the data for 2023-Q4 changes from a projected value (lighter blue) to a historic value (darker blue), most of the real action happens in the projections for each quarter of 2024.
In particular, if you look at the bar for the second quarter of 2024, you'll see this quarter (marked as 2024-Q2) has risen so much that it starting to "break through" the top of the chart. This increase is why we will soon have to reset the vertical scale for the chart.
You'll also see the outlook for each future quarter's dividends has improved in the period from mid-November 2023 to mid-March 2024. That improved outlook provides the underlying support for the S&P 500's recent series of record highs.
Looking beyond 2024-Q2, you'll see something unusual. There's projected drop-off in quarterly dividends between 2024-Q2 and 2024-Q3. It's unusual because we would ordinarily expect to see the third quarter's anticipated dividends fall in between the projected values for the second and fourth quarters. And since the outlook for the index' dividends in all quarters has been improving, we would have at least expected to see it close the gap between the second and fourth quarter's values.
But it hasn't. If anything, the projected drop-off in the dividends expected to be paid from 2024-Q2 to 2024-Q3 has been remarkably persistent in all the months we have been observing it and has increased in size. That persistence suggests investors have potentially built in expectations of turbulence ahead for dividend paying stocks.
That market turbulence would most likely take place during the upcoming quarter of 2024-Q2, which would subsequently show up in the dividends paid in the following quarter of 2024-Q3. Since quarterly dividends are projected to rise in 2024-Q4, that suggests investors expect this turbulence will be relatively short-lived.
At least, that's the implied expectation at this juncture. The most important thing to remember about the future is that it's subject to change with little notice.
Image Credit: Microsoft Copilot Designer.. Prompt: "A fortune teller looking into a crystal ball to make a prediction about the S&P 500".
Labels: dividends, forecasting, SP 500
Welcome to the blogosphere's toolchest! Here, unlike other blogs dedicated to analyzing current events, we create easy-to-use, simple tools to do the math related to them so you can get in on the action too! If you would like to learn more about these tools, or if you would like to contribute ideas to develop for this blog, please e-mail us at:
ironman at politicalcalculations
Thanks in advance!
Closing values for previous trading day.
This site is primarily powered by:
CSS Validation
RSS Site Feed
JavaScript
The tools on this site are built using JavaScript. If you would like to learn more, one of the best free resources on the web is available at W3Schools.com.

