Ernest Hemingway wrote one of the great lines about how change happens in The Sun Also Rises. Here is the set-up and delivery:
“How did you go bankrupt?” Bill asked.
“Two ways,” Mike said. “Gradually and then suddenly.”
The phrase "gradually and then suddenly" captures the nature of how real world change happens in ways that go far beyond the context of bankruptcy discussed by the characters in Hemingway's 1926 novel.
Applied to the employment situation of U.S. teens, that phrase is relevant because we're seeing some small changes in the trends being reported in the employment data for this demographic group. That matters because teens represent the most marginal members of the U.S. work force, having the least education, least training, and least work experience of all workers in the U.S. economy. And as a general rule, the younger the teen, the more marginal they are as a member of the U.S. work force because they lack the education, training, and work experience acquired by all older workers.
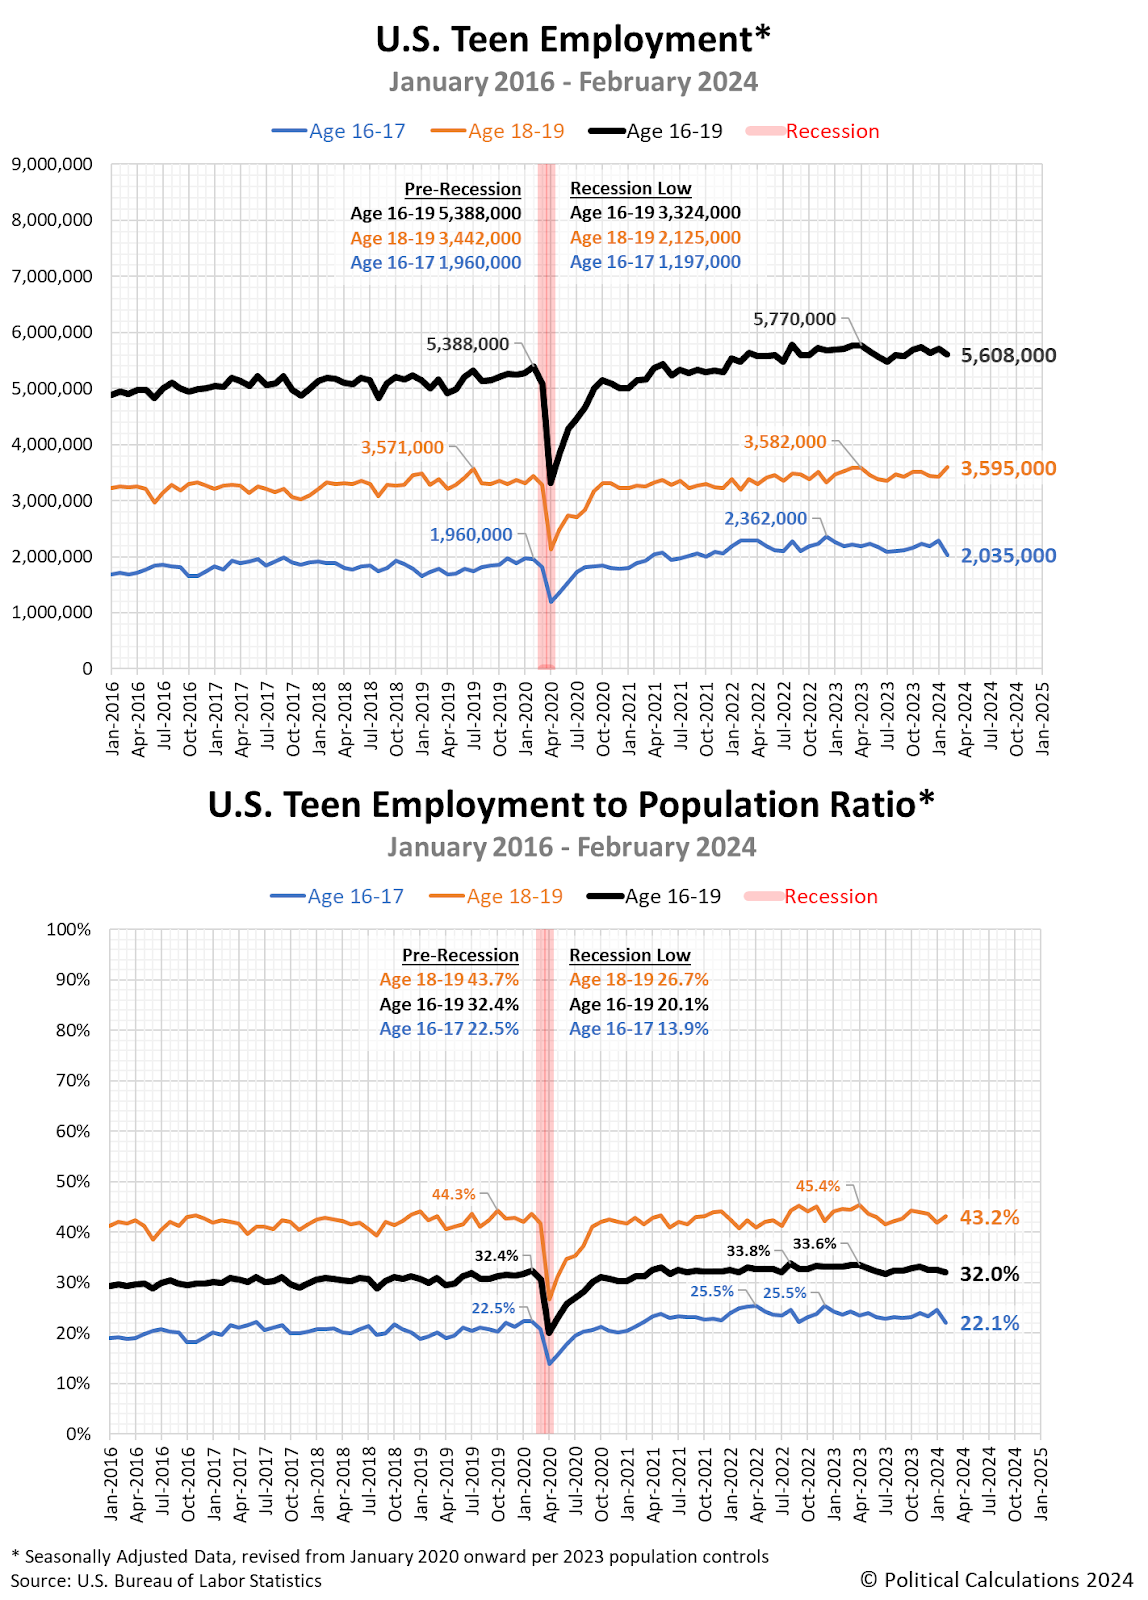
The following charts visualize the seasonally-adjusted numbers for the number of working teens in the U.S., showing the employment figures and employment-to-population percentages for younger teens (Age 16-17) and older teens (Age 18-19) as well as the combined population of working Age 16-19 year olds.
Since each of these data series receives its own seasonal adjustment, the numbers of working Age 16-17 year olds and Age 18-19 year olds won't necessarily add up to the totals shown for the combined Age 16-19 population. If you're looking for employment figures that do add up, you'll want to review non-seasonally adjusted data.
Looking at the most current trends, we find some small changes developing for the teen employment situation in the U.S.
- As a percentage of the available teen population, overall teen employment peaked at 60.4% in July-August 2023 and has slowly decreased in the months since, declining to 60.1% through February 2024.
- Older teens (Age 18-19) have seen their seasonally adjusted numbers generally rise over this period, with their employment data showing a flat-to-slightly rising trend and their employment-to-population ratio showing a slightly falling trend.
- But younger teens are seeing erosion in their employment numbers, with both the number of employed Age 16-17 year olds and their employment-to-population ratio falling. In February 2024, the number and percentage of employed Age 16-17 year olds has dropped to their lowest level since October 2021. Both peaked in December 2022.
Even though the number of younger working teens is much smaller than the number of older working teens, the changes being experienced within this demographic group are large enough to affect the overall trend for the entire population of working teens. The falling employment and employment-to-population ratio for younger teens since December 2022 indicates U.S. economic growth isn't as strong as it was before December 2022. The fading employment prospects for the most marginal portion of the U.S. work force is one reason the Federal Reserve clearly signaled it will cut interest rates this year.
Keep in mind the Fed would have no reason to cut rates if they thought U.S. economic growth and employment would continue to be either positive or stable without that action. They're responding to gradually developing negative trends in signaling a slow pace of rate cuts this year. How do you suppose they'll respond if those negative changes start happening more suddenly?
References
U.S. Bureau of Labor Statistics. Labor Force Statistics (Current Population Survey - CPS). [Online Database]. Accessed: 20 March 2024.
Image Credit: Microsoft Copilot Designer. Prompt: "A 16 year old applying for a job."
Labels: jobs
Welcome to the blogosphere's toolchest! Here, unlike other blogs dedicated to analyzing current events, we create easy-to-use, simple tools to do the math related to them so you can get in on the action too! If you would like to learn more about these tools, or if you would like to contribute ideas to develop for this blog, please e-mail us at:
ironman at politicalcalculations
Thanks in advance!
Closing values for previous trading day.
This site is primarily powered by:
CSS Validation
RSS Site Feed
JavaScript
The tools on this site are built using JavaScript. If you would like to learn more, one of the best free resources on the web is available at W3Schools.com.

