The Super-Tuesday presidential primaries have come and gone in the United States. Along with them is any question of which political candidates will collect enough delegates to win their respective major party's nomination for president in the 2024 elections. Barring unforeseen events, Donald Trump will be the Republican nominee and Joe Biden will be the Democratic nominee. It's going to be an excruciatingly long election season.
The day after Super Tuesday, the U.S. Census Bureau released its data on the U.S.' international trade for January 2024. That new data gives us an opportunity to compare the trade policies of the two candidates, since Trump served as U.S. President from January 2017 to January 2021 and Biden has served as U.S. President in the period since.
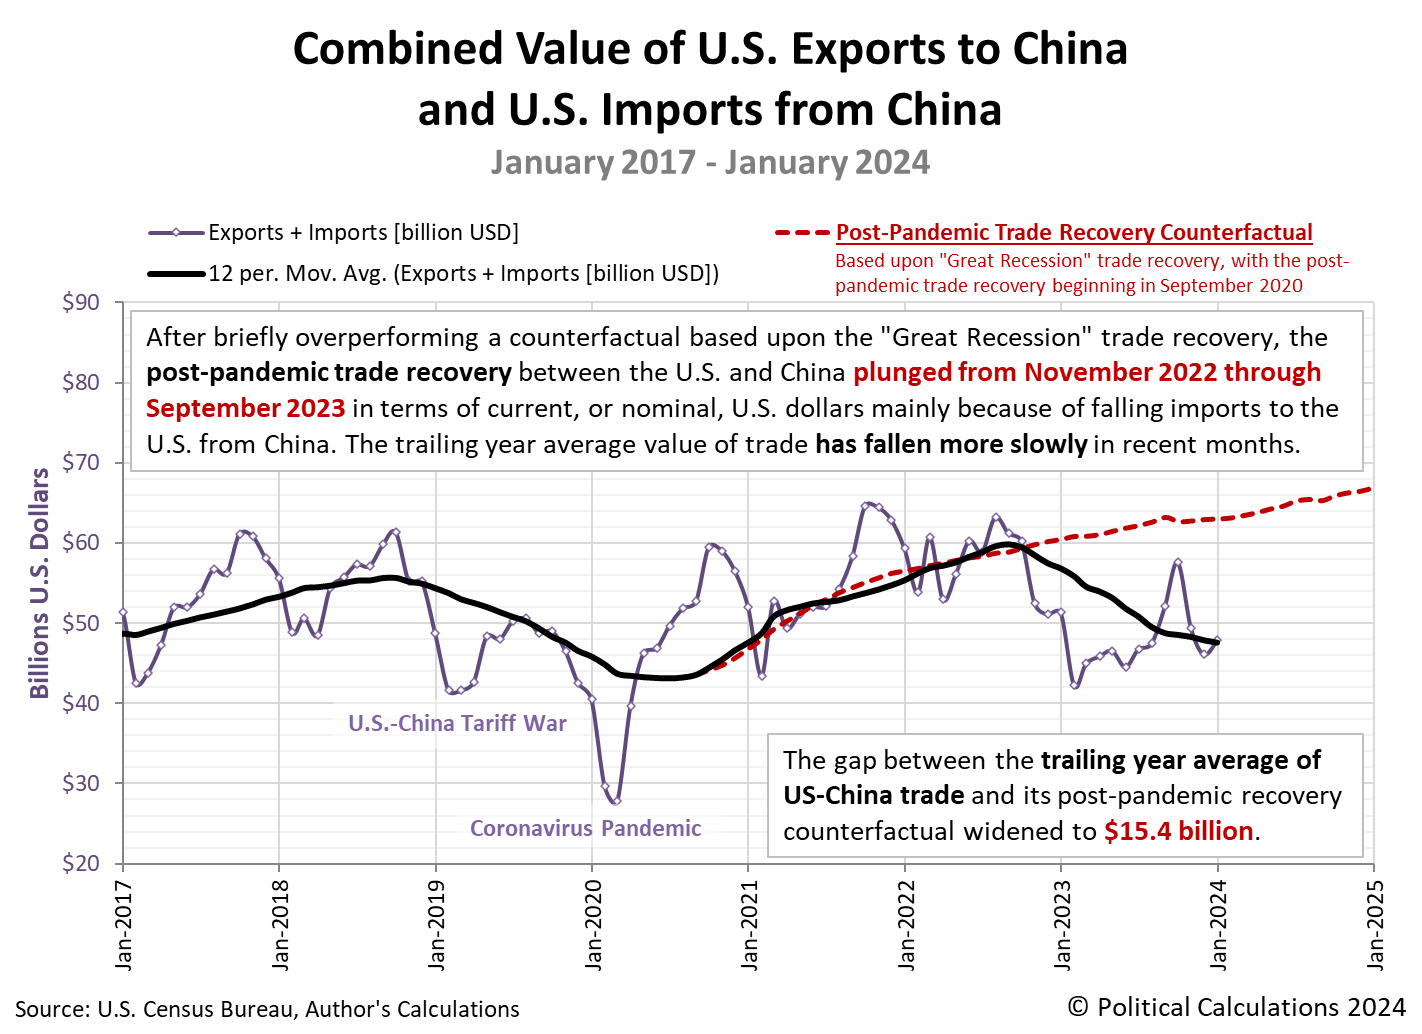
The following chart provides a picture of that history as measured by the value of the goods exchanged between the United States and China from January 2017 through January 2024. Both candidates made trade with China a central part of their respective presidencies and as such, it can tell us a lot about their policies.
As president, both candidates implemented anti-free trade policies focusing on trade between the U.S. and China in particular. Those policies contributed to serious declines in the goods exchanged between to two countries. But in Trump's case, those policies overlapped with 2020's Coronavirus Pandemic, which caused trade between the two countries to fall even further than it would otherwise have, which adds a complicating factor to any comparison.
Or does it? What if we directly compared the two declines in trade between the U.S. and China as a percentage of the pre-decline peak recorded during both presidential terms? For Trump, that peak took hold after October 2018, when China's 'madman' retaliation against the tariffs Trump had imposed earlier in 2018 impacted the international trade data, but long before the pandemic had any effect. For Biden, the equivalent "Month 0" is October 2022, when he announced export restrictions to block China from importing advanced semiconductor technology from the U.S.
The next chart shows the negative impact resulting from the anti-free trade policies of both presidents, as measured by the percentage change in the trailing twelve month average of the total value of goods exchanged each month between the two countries.
Measured this way, we can identify the point in time at which 2020's coronavirus pandemic would have impacted trade between the two countries, allowing us to visually compare the periods where only the results of the trade policies of the two candidates affected it. The data is clear, President Biden's anti-free trade policies have had a more negative impact than those of President Trump.
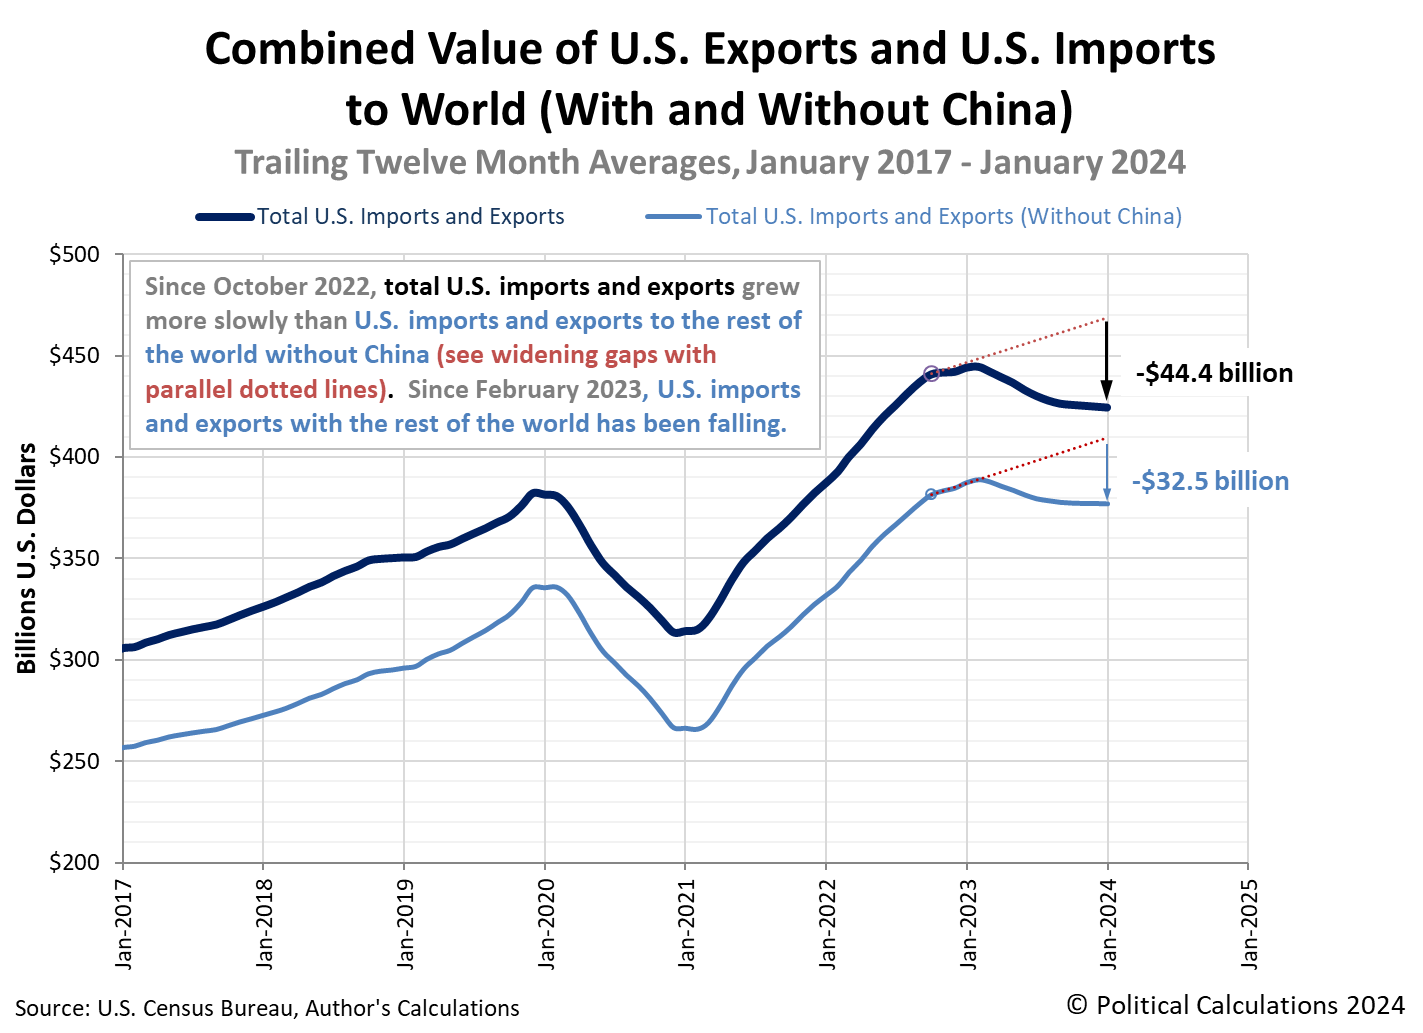
It's not just China either. As the final chart shows, trade between the United States and the rest of the world has been much more negative as a result of President Biden's anti-free trade policies than they were under President Trump.
Despite Trump's tariff policies, trade between the U.S. and the rest of the world increased during his term in office aside from the period affected by the Coronavirus Pandemic. Under President Biden's trade policy, trade between the U.S. and the rest of the world has been shrinking.
We don't plan to wade any deeper into the U.S. political waters of 2024 than we have, except to observe that neither candidate is good on trade and of the two, one has been unquestionably worse than the other. That candidate is not Donald Trump, which is a sentence we never thought we'd ever be writing, but here we are.
We're looking forward to going back to mostly ignoring the already too-long election campaign.
References
U.S. Census Bureau. Trade in Goods with China. Last updated: 7 March 2024.
U.S. Census Bureau. Trade in Goods with World, Not Seasonally Adjusted. Last updated: 7 March 2024.
Image Credit: Microsoft Copilot Designer. Prompt: "Global trade routes".
Labels: trade
Welcome to the blogosphere's toolchest! Here, unlike other blogs dedicated to analyzing current events, we create easy-to-use, simple tools to do the math related to them so you can get in on the action too! If you would like to learn more about these tools, or if you would like to contribute ideas to develop for this blog, please e-mail us at:
ironman at politicalcalculations
Thanks in advance!
Closing values for previous trading day.
This site is primarily powered by:
CSS Validation
RSS Site Feed
JavaScript
The tools on this site are built using JavaScript. If you would like to learn more, one of the best free resources on the web is available at W3Schools.com.


