2024 has started where 2023 left off when it comes to the state of how affordable new homes are in the United States. With the typical new home sold out of affordable reach for the typical American household.
There are three data points that come together to determine how affordable a new home being sold in the U.S. is for a typical U.S. household:
- The median price of a new home sold during the month. For January 2024, the U.S. Census Bureau reported its initial estimate of the median price of a new home sold in January 2024 is $420,700. This figure is considered to be the price of a typical new home sold, because half of all new homes sold in the U.S. cost their new homeowners more than this amount, while half cost less.
- The median income of an American household represents the middle point for the income distribution of households in the United States. For January 2024, our estimate of median household income for January 2024 is $77,283. Since our affordability analysis has been developed using our estimates, we'll be using this figure in the following analysis. This figure is very close to Motio Research's estimate of $77,397, which is based on data collected as part of the U.S. Census Bureau's monthly Current Population Survey. Motio Research began providing their monthly estimates in November 2023.
- The average interest rate for a conventional 30-year fixed-rate mortgage in January 2024 is 6.64%. This estimated monthly mortgage rate is taken as the average of weekly 30-year conventional mortgage rates reported by Freddie Mac during the month. Data for the median monthly conventional 30-year fixed-rate mortgage rate is not available.
For our affordability analysis, we're using this information to find the monthly payment taken out at the average 30-year mortgage rate to cover the entire price of the median new home sold in January 2024. We then divide that figure by the monthly equivalent of the median household income, which gives us the percentage of that typical household income that would be consumed to pay for the cost of the typical new home sold in the U.S.
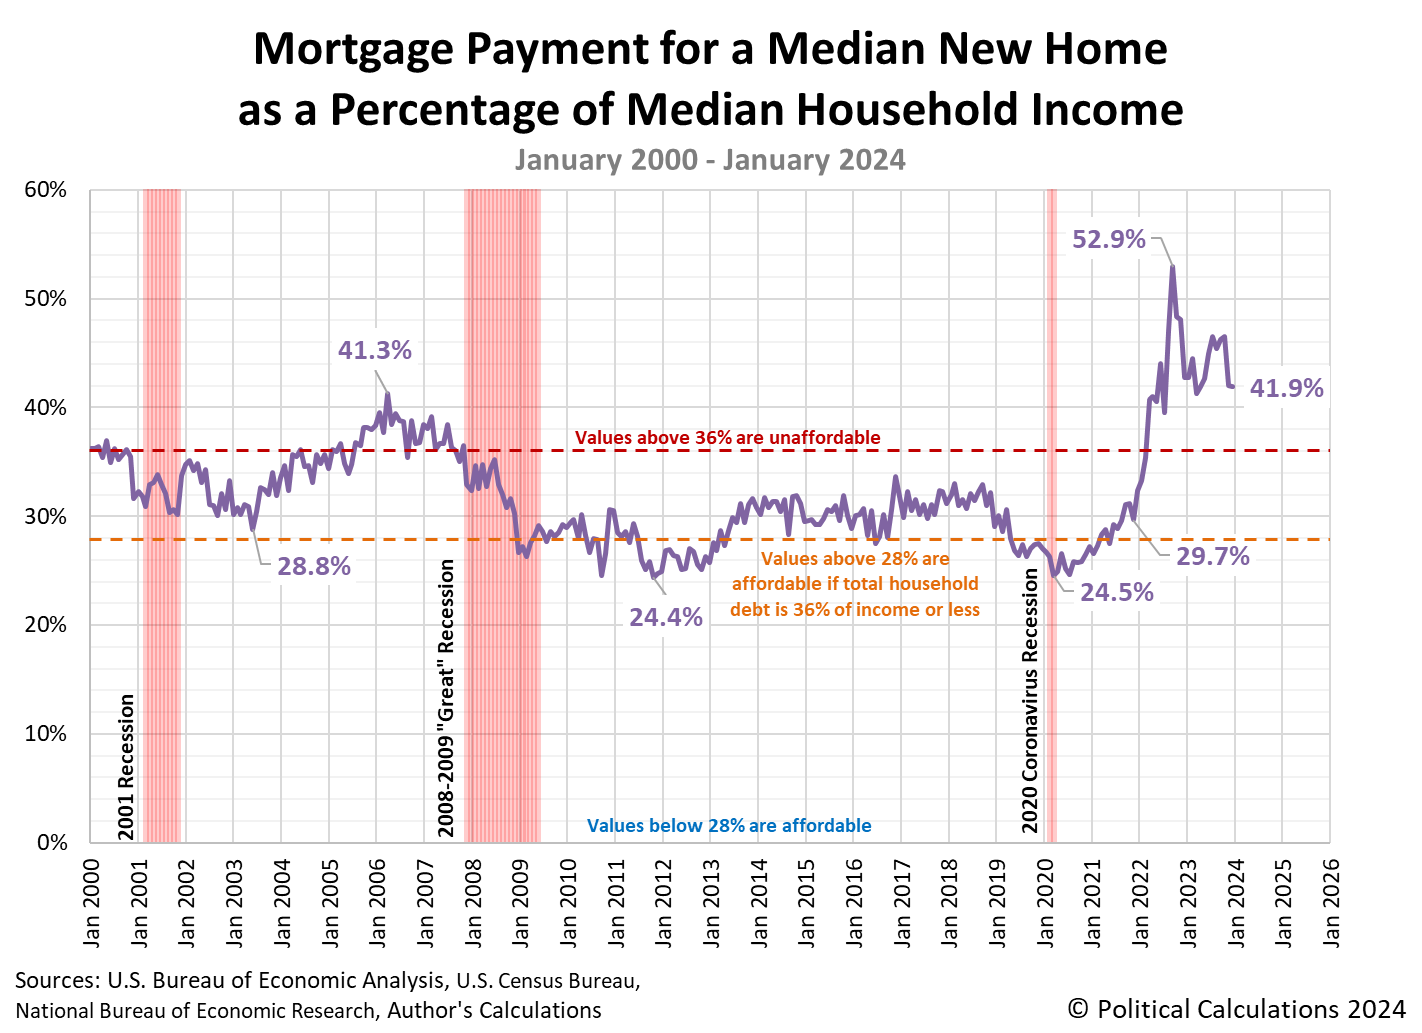
The following chart visualizes the results of that math from January 2000 through January 2024.
For January 2024, the cost of paying a mortgage for the typical new home sold in the United States would consume 41.9% of the income of a typical American household. This figure is well above the 28% mortgage debt-to-income ratio and 36% total debt-to-income ratio thresholds that mortgage lenders set for borrowers to ensure they are capable of supporting their mortgage payments.
The mortgage payment for a median new home sold has consistently exceeded the 28% basic affordability threshold since February 2021 and the higher 36% affordability threshold since March 2022.
Doing some back-of-the-envelope math, we estimate a household with an annual income of $90,000 or more in January 2024 could afford the mortgage payment for the median new home sold in the U.S., assuming that was their only debt, per the 36% debt-to-income ratio. A household with an annual income exceeding $115,700 would be able to afford the median new home sold in January 2024 at the 28% threshold.
We anticipate next month will be more challenging for new home affordability as mortgage rates rose during February 2024.
References
U.S. Census Bureau. New Residential Sales Historical Data. Houses Sold. [Excel Spreadsheet]. Accessed 26 February 2024.
U.S. Census Bureau. New Residential Sales Historical Data. Median and Average Sale Price of Houses Sold. [Excel Spreadsheet]. Accessed 26 February 2024.
Freddie Mac. 30-Year Fixed Rate Mortgages Since 1971. [Online Database]. Accessed 1 February 2024. Note: Starting from December 2022, the estimated monthly mortgage rate is taken as the average of weekly 30-year conventional mortgage rates recorded during the month.
Political Calculations. Median Household Income in December 2023. [Online article]. 1 March 2024.
Image Credit: Mortgage Application Form by Nick Youngson/Alpha Stock Images on Picserver.org. Creative Commons CC-BY-SA 3.0.
Labels: personal finance, real estate
Welcome to the blogosphere's toolchest! Here, unlike other blogs dedicated to analyzing current events, we create easy-to-use, simple tools to do the math related to them so you can get in on the action too! If you would like to learn more about these tools, or if you would like to contribute ideas to develop for this blog, please e-mail us at:
ironman at politicalcalculations
Thanks in advance!
Closing values for previous trading day.
This site is primarily powered by:
CSS Validation
RSS Site Feed
JavaScript
The tools on this site are built using JavaScript. If you would like to learn more, one of the best free resources on the web is available at W3Schools.com.

