to your HTML Add class="sortable" to any table you'd like to make sortable Click on the headers to sort Thanks to many, many people for contributions and suggestions. Licenced as X11: http://www.kryogenix.org/code/browser/licence.html This basically means: do what you want with it. */ var stIsIE = /*@cc_on!@*/false; sorttable = { init: function() { // quit if this function has already been called if (arguments.callee.done) return; // flag this function so we don't do the same thing twice arguments.callee.done = true; // kill the timer if (_timer) clearInterval(_timer); if (!document.createElement || !document.getElementsByTagName) return; sorttable.DATE_RE = /^(\d\d?)[\/\.-](\d\d?)[\/\.-]((\d\d)?\d\d)$/; forEach(document.getElementsByTagName('table'), function(table) { if (table.className.search(/\bsortable\b/) != -1) { sorttable.makeSortable(table); } }); }, makeSortable: function(table) { if (table.getElementsByTagName('thead').length == 0) { // table doesn't have a tHead. Since it should have, create one and // put the first table row in it. the = document.createElement('thead'); the.appendChild(table.rows[0]); table.insertBefore(the,table.firstChild); } // Safari doesn't support table.tHead, sigh if (table.tHead == null) table.tHead = table.getElementsByTagName('thead')[0]; if (table.tHead.rows.length != 1) return; // can't cope with two header rows // Sorttable v1 put rows with a class of "sortbottom" at the bottom (as // "total" rows, for example). This is B&R, since what you're supposed // to do is put them in a tfoot. So, if there are sortbottom rows, // for backwards compatibility, move them to tfoot (creating it if needed). sortbottomrows = []; for (var i=0; i
Looking for the latest turkey production numbers? See here!
What would any discussion of the Thanksgiving holiday be without the centerpiece of the celebration that it is built around: the turkey? In just looking at this one item in the period from 1989 through 2004, we can see the phenomenal growth of U.S. productivity – particularly in agriculture. We will begin by looking at the number of turkeys produced each year in the United States:
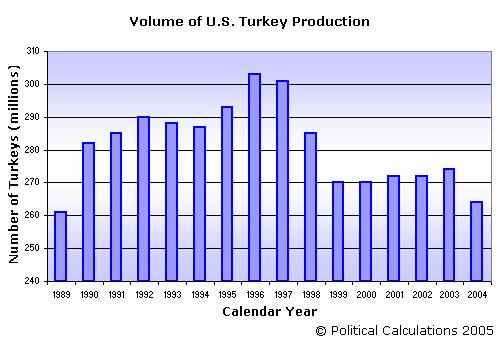
The chart above shows the change in the number of turkeys produced in the U.S. from 1989 through 2004. During that time, the number of turkeys grew from 261 million in 1989, peaked in 1996 at 303 million turkeys, and has dropped since back to 263 million turkeys in 2004. Now, you might think that the decline in the number of turkeys would mean that Americans are consuming less turkey, but that’s not necessarily the case. The next chart shows the production of turkeys in the U.S. by weight – with data for the turkeys Live Weight and Ready-To-Cook (RTC) Inspected Weight:
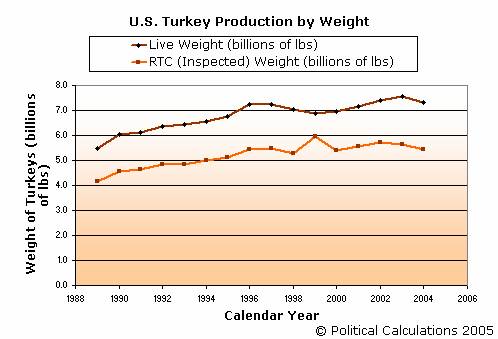
Aside from noting the spike in the RTC Inspected Weight in 1999, which is likely an error in the data source for these statistics, we see that the produced weight of U.S. turkeys has trended upward from 1989 through 2004. Going back to the turkey production volume data, we would expect to see that trend up to 1996-1997, followed by a drop as the number of turkeys produced in the U.S. has declined by 13%. Instead, we see that the weight of turkeys produced in the U.S. has continued to trend upward.
How is this possible? In a nutshell, it is because the U.S. turkey farmer has become dramatically more productive, raising fewer turkeys, but much larger ones! The following chart was generated using the data reported above and shows the average weight of the U.S. produced turkey from 1989 through 2004:
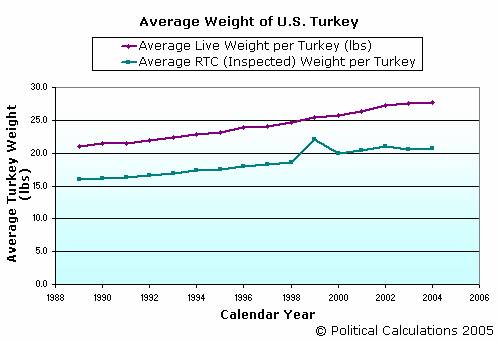
From 1989 through 2004, the weight of the average turkey has increased from 21.0 to 27.7 lbs (Live Weight) – an increase of 32.1%. Meanwhile, the RTC (Inspected) Weight has increased from 16.0 to 20.7 lbs – an increase of 29.2%.
So, there you go – the U.S. turkey farmer is remarkably more productive today than the turkey farmers of 16 years ago were. And for what it is worth, at least now you have something to say about turkeys around your Thanksgiving dinner table that doesn’t have anything to do with that substance in it that makes you sleepy!
Labels: thanksgiving, turkey
Welcome to the blogosphere's toolchest! Here, unlike other blogs dedicated to analyzing current events, we create easy-to-use, simple tools to do the math related to them so you can get in on the action too! If you would like to learn more about these tools, or if you would like to contribute ideas to develop for this blog, please e-mail us at:
The S&P 500 at Your Fingertips
Mapping S&P 500 Performance, Since 1871
Should You Trade In Your Gas Guzzler?
What Are the Chances Your Marriage Will Last?
Reckoning the Odds of Recession
Your 2009 Paycheck
Tipping Around the World
Revisiting the Lottery
Estimating Your Life Expectancy
Connecting the Dots for Personal Income Taxes
First Time Visitor to Political Calculations?
On the Moneyed Midways
A Lot, But Not All, of Our Tools
Political Calculations' Recession Probability Track shows the probability that the U.S. economy will be in recession 12 months from the indicated date (shown in red) while revealing the probability trend over the past four years.
Previously, the probability of recession peaked at 50% on 4 April 2007, which means that March-April 2008 was the most likely period in which the NBER would have found the U.S. to be in recession.
As it happens, they almost did. The NBER instead chose December 2007 as the beginning month of the most recent recession (we had found a 46% probability for a recession beginning in that month!)
Political Calculations is also the online home of On the Moneyed Midways (aka OMM), a review of the best posts contributed to the week's best business and money-related blog carnivals. More than that, we also name one post in each edition as being The Best Post of the Week, Anywhere! and at the end of each year, we name The Best Post of the Year, Anywhere! as well as identifying the best blogs we found during the course of the year!
The link below will take you to the running index containing our most recent back issues (you can easily navigate the index to find older editions.)
This site is primarily powered by:
Visitors since December 6, 2004:
The tools on this site are built using JavaScript. If you would like to learn more, one of the best free resources on the web is available at W3Schools.com.
MBA by Blog - We're a contributor!
ZunZun
Wolfram Integrator
Create a Graph