 How much does it cost U.S. employers to provide health insurance to their employees?
As it happens, the answer depends on what kind of health insurance that employers make available to their employees, the number of people who are covered by the employee's insurance and also the size of the company for which they work.
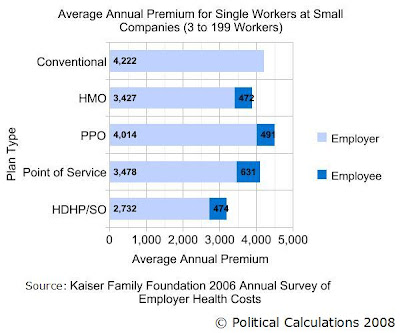
Our first two charts revealing how much the average annual premiums are by health insurance plan type presents how much it costs both employees and employers for covered Single workers, at both small companies (those between 3 and 199 workers):

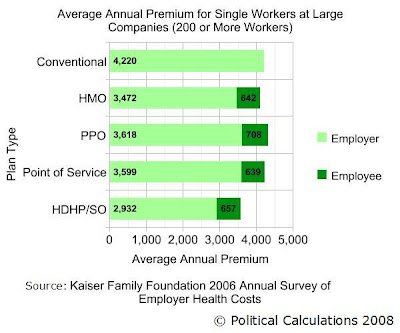
and large companies (those with more than 200 workers):

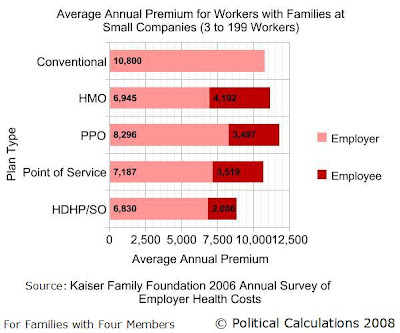
The next two charts present similar data for workers whose families are also covered by the various employer-provided health insurance plan types, first for those working at small companies (data is for a family of four):

and now for those working for companies with more than 200 employees:

The tables we're presenting below are drawn from the Kaiser Family Foundation's 2006 Annual Survey of Employer Health Benefits, provide the average annual costs according to these factors and also break down how much of the total cost is paid by the employer and how much is paid by the employee. We've used our dynamic table sorting technology in creating the tables, which allows you to rank the date in the tables by clicking the appropriate column heading so you can find which types of plans are the most or least costly. The first table provides data for covered single workers:
| 2006 Average Annual Premiums for Covered Single Workers by Plan Type |
|---|
| Plan Type | Firm Size (Number of Workers) | Total Annual Cost [$USD] | Employer Annual Contribution [$USD] | Employer's Percentage of Total Cost | Employee Annual Contribution [$USD] | Employee's Percentage of Total Cost |
|---|---|---|---|---|---|---|
| Conventional | Small (3-199) | 4,222 | 4,222 | 100.0% | 0 | 0.0% |
| Conventional | Large (200+) | 4,020 | 4,020 | 100.0% | 0 | 0.0% |
| HMO | Small (3-199) | 3,899 | 3,427 | 87.9% | 472 | 12.1% |
| HMO | Large (200+) | 4,114 | 3,472 | 84.4% | 642 | 15.6% |
| PPO | Small (3-199) | 4,505 | 4,014 | 89.1% | 491 | 10.9% |
| PPO | Large (200+) | 4,326 | 3,618 | 83.6% | 708 | 16.4% |
| POS | Small (3-199) | 4,109 | 3,478 | 84.6% | 631 | 15.4% |
| POS | Large (200+) | 4,238 | 3,599 | 84.9% | 639 | 14.8% |
| HDHP/SO | Small (3-199) | 3,206 | 2,732 | 85.2% | 474 | 14.8% |
| HDHP/SO | Large (200+) | 3,589 | 2,932 | 81.7% | 657 | 18.3% |
The next table provides data for covered workers with families consisting of four members. Note that for many of the plans, while the employer's portion is less than four times their cost for a single worker, the employee's portion of the total premium cost for each type of plan is approximately four times that of a single worker, or even more:
| 2006 Average Annual Premiums for Covered Workers with Families by Plan Type |
|---|
| Plan Type | Firm Size (Number of Workers) | Total Annual Cost [$USD] | Employer Annual Contribution [$USD] | Employer's Percentage of Total Cost | Employee Annual Contribution [$USD] | Employee's Percentage of Total Cost |
|---|---|---|---|---|---|---|
| Conventional | Small (3-199) | 10,800 | 10,800 | 100.0% | 0 | 0.0% |
| Conventional | Large (200+) | 10,829 | 10,829 | 100.0% | 0 | 0.0% |
| HMO | Small (3-199) | 11,137 | 6,945 | 62.4% | 4,192 | 37.6% |
| HMO | Large (200+) | 11,339 | 8,741 | 77.1% | 2,598 | 22.9% |
| PPO | Small (3-199) | 11,793 | 8,296 | 70.3% | 3,497 | 29.7% |
| PPO | Large (200+) | 11,752 | 9,124 | 77.6% | 2,628 | 22.4% |
| POS | Small (3-199) | 10,706 | 7,187 | 67.1% | 3,519 | 32.9% |
| POS | Large (200+) | 11,573 | 8,688 | 75.1% | 2,885 | 24.9% |
| HDHP/SO | Small (3-199) | 8,896 | 6,830 | 76.8% | 2,006 | 23.2% |
| HDHP/SO | Large (200+) | 10,013 | 7,604 | 75.9% | 2,409 | 24.1% |
Descriptions of the various types of health insurance plans are available through our post showing which types of plans were the most commonly used in the United States in 2006!
Where are we going with all this? Not necessarily where you might think, although we're aiming to get there next week!
Update (31 January 2008): Added charts showing the data in the tables!
Labels: health care
Welcome to the blogosphere's toolchest! Here, unlike other blogs dedicated to analyzing current events, we create easy-to-use, simple tools to do the math related to them so you can get in on the action too! If you would like to learn more about these tools, or if you would like to contribute ideas to develop for this blog, please e-mail us at:
ironman at politicalcalculations
Thanks in advance!
Closing values for previous trading day.
This site is primarily powered by:
CSS Validation
RSS Site Feed
JavaScript
The tools on this site are built using JavaScript. If you would like to learn more, one of the best free resources on the web is available at W3Schools.com.