Last week, we featured a quote by President John F. Kennedy in which he stated in a speech to the Economic Club of New York on December 14, 1962 that:
"it is a paradoxical truth that tax rates are too high today and tax revenues are too low - and the soundest way to raise revenues in the long run is to cut rates now."
That left us with a hanging question. Is he right?
To find out, at least using our back-of-the-envelope methods, we decided to do a quick comparison between 1954 and today, at least as represented by the tax rates and income tax revenue for 2006. Why 2006? Well, those income taxes for 2007 are still in the process of being collected (remember, April 15 is a week away, and that's not even taking those who'll be filing for extensions instead of taxes into account....)
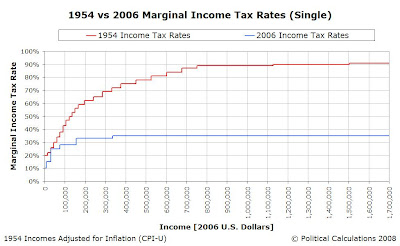
So our first comparison is to look at the extremely progressive income tax rates of 1954 vs the more moderately progressive income tax rates of 2006, after adjusting the 1954 income bracket thresholds for inflation. The chart below shows our initial result over the range from $0 to $1.7 million in 2006 U.S. dollars:

So we can see right off that tax rates are generally much lower today than they were 52 years previously, with the general exception of those earning between $30,650 and $45,113 in constant 2006 U.S. dollars, whose statutory tax rates are only slightly lower today than in 1954.
In the next part of our back-of-the-envelope analysis, we'll look at the percentage of GDP that each year's personal income tax revenue represented. Here, we used the nominal GDP figures for 1954 and 2006 that we obtained from the invaluable Measuring Worth website. For the percentage of GDP represented by personal income taxes in 1954, we used this report produced by the left-leaning Center on Budget and Policy Priorities. For the same 2006 figure, we found the amount of personal income tax revenue collected for 2006 in this Congressional Budget Office report, and found the percentage by dividing the corresponding GDP figure we obtained from the Measuring Worth site.
This latter additional step provides for as close to an apples-to-apples comparison as we can get for later analysis and accounts for the minor difference between the percentage share of GDP between the CBO's report value of 8.0% and our calculated value of 7.9%.
The following chart reveals the share of GDP represented by both 1954 and 2006's personal income tax revenues:

Remarkably, despite having a much more progressive income tax rate structure with much higher income tax rates in 1954, the percentage share of GDP for both 1954 and 2006 is nearly identical, coming in at 7.8% and 7.9% respectively.
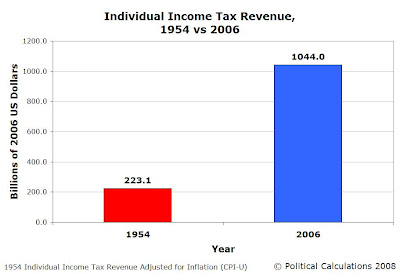
We also provided the nominal (non-inflation adjusted) GDP figures for 1954 and 2006 in the chart above. Our next step was to adjust these figures for inflation and, as with the income levels previously, we adjusted these figures according to changes in the Consumer Price Index for Urban Consumers (CPI-U). Then we multiplied the results for each year by the percentage shares of GDP, which will provide the inflation adjusted revenue for each year in constant 2006 U.S. dollars. The following chart shows our final results:

We find that revenue generated by the much flatter income tax rate structure of 2006 is nearly 4.7 times that produced by the much more progressive income tax rate structure of 1954, coming in at $1,044 billion compared to $223.1 billion respectively.
We likewise find, as the result of this back-of-the-envelope analysis, that John F. Kennedy is right.
Labels: taxes
Welcome to the blogosphere's toolchest! Here, unlike other blogs dedicated to analyzing current events, we create easy-to-use, simple tools to do the math related to them so you can get in on the action too! If you would like to learn more about these tools, or if you would like to contribute ideas to develop for this blog, please e-mail us at:
ironman at politicalcalculations
Thanks in advance!
Closing values for previous trading day.
This site is primarily powered by:
CSS Validation
RSS Site Feed
JavaScript
The tools on this site are built using JavaScript. If you would like to learn more, one of the best free resources on the web is available at W3Schools.com.