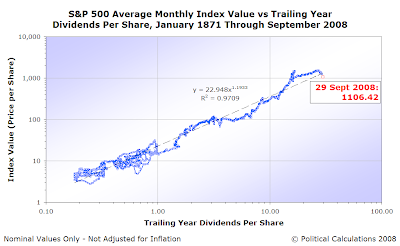
With the U.S. stock market plummeting today on news that the leadership of the U.S. House of Representatives failed to deliver a bailout package to ensure that banks and financial institutions would be able to resume lending to one another in the current panic, we thought we might present the following two charts to help place the stock market's reaction into better historical context.
The first chart will be familiar to regular readers of Political Calculations. It shows the average monthly index value of the S&P 500 versus the index' trailing year dividends per share since order initially broke down in the market beginning in January 2008:

Without the market action today, the average decline of the S&P 500 index during the month of September through Friday, 26 September 2008, would be sufficient to provide the two-standard-deviation decline early warning signal that we've identified as frequently occurring prior to historic breaks in order.
The next chart puts things in a much longer term focus. We've mapped the average monthly index value for the S&P 500 from January 1871 through August 2008, with a single data point indicating where the market closed on 29 September 2008, presenting both axes of the chart on logarithmic scales:

The portion of the chart with a trailing year dividend per share greater than $1.00 is consistent with the modern era of the stock market, which began in January 1952.
At present however, the action of the market would seem to more closely resemble the post-Civil War period, perhaps a result of the similarity between the current crisis and the banking panics of the late 1800's and early twentieth century.
Labels: dividends, SP 500, stock market
Welcome to the blogosphere's toolchest! Here, unlike other blogs dedicated to analyzing current events, we create easy-to-use, simple tools to do the math related to them so you can get in on the action too! If you would like to learn more about these tools, or if you would like to contribute ideas to develop for this blog, please e-mail us at:
ironman at politicalcalculations
Thanks in advance!
Closing values for previous trading day.
This site is primarily powered by:
CSS Validation
RSS Site Feed
JavaScript
The tools on this site are built using JavaScript. If you would like to learn more, one of the best free resources on the web is available at W3Schools.com.