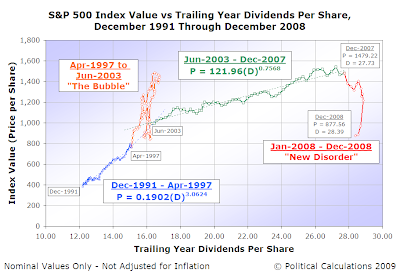
2008 was very definitely not a good year for stock prices as the stock market entered a new period of disorder, somewhat resembling the very opposite of a bubble. But don't just take our word for it - the chart below shows seventeen years of stock market history, plotting the average of each month's daily closing values for the S&P 500 against the index' trailing year dividends per share:

We've corrected the chart above to incorporate a minor correction for the average daily closing value of the S&P 500 for December 2008. The original version is available here.
As you can see, the magnitude of how far stocks fell in 2008 is pretty much in line with how much they rose during the inflation phase of the Dot-Com Bubble, making the current disorder resemble the "evil twin" of the bubble's upward trajectory from April 1997 through August 2000.
We'll also note that S&P is currently indicating that dividend payments for the S&P 500 in 2008 appears to have come in higher than what they had previously projected, at $28.39 per share (with $7.15 for the fourth quarter of 2008) compared to their October 2008 projection of $28.05 for the year.
As for corporate earnings, S&P has revised those downward for much of 2008 (HT: Barry Ritholtz). Looking forward from the $48.05 earnings per share figure now recorded for the fourth quarter of 2008, the forecasts for each quarter in 2009 is for $43.71 per share in 2009Q1, $40.43 in 2009Q2, $41.02 in 2009Q3 and $42.24 in the fourth quarter.
We've already incorporated these changes in our signature S&P 500 at Your Fingertips tool, and will be updating the tool again to include December 2008 on 16 January 2009, coinciding with the scheduled release of that month's inflation data from the Bureau of Labor Statistics.
Labels: dividends, earnings, SP 500, stock market
Welcome to the blogosphere's toolchest! Here, unlike other blogs dedicated to analyzing current events, we create easy-to-use, simple tools to do the math related to them so you can get in on the action too! If you would like to learn more about these tools, or if you would like to contribute ideas to develop for this blog, please e-mail us at:
ironman at politicalcalculations
Thanks in advance!
Closing values for previous trading day.
This site is primarily powered by:
CSS Validation
RSS Site Feed
JavaScript
The tools on this site are built using JavaScript. If you would like to learn more, one of the best free resources on the web is available at W3Schools.com.