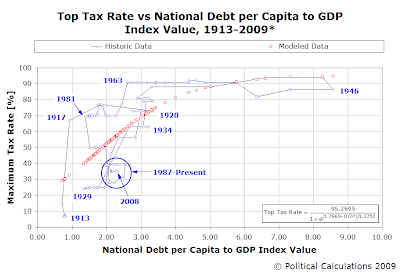
 Now that we've mapped a relationship between the national debt and the maximum income tax rate, we're celebrating the annual filing of our U.S. income tax returns today by presenting a tool based on our analysis!
The tool below may be used to approximate how politicians might set the top income tax rate in the United States, given:
- The amount of the U.S. national debt.
- The size of the U.S. economy.
- The number of Americans.
Best of all, you can update the tool with the latest figures coming out from Washington D.C. so you can anticipate how tax rates might change given the latest policies and economic situation as well as how U.S. politicians have responded to similar debt loads in the past.

We see this at several points in history, such as in 1917 when the U.S. Congress and President Woodrow Wilson cranked up the then new income tax rates in anticipation of funding World War I, which was followed shortly by massive increases in the national debt, bringing both the maximum tax rate and level of debt in tune with our modeled relationship. We see the reverse pattern in 1963, with the implementation of then President John F. Kennedy's tax cuts, which came as the level of the national debt per capita was falling while the economy was growing.
In 1981, we see something especially remarkable: a simultaneous significant tax rate decrease and relatively small and steady increases in national debt during President Ronald Reagan's first term, bringing the relationship between the level of the U.S. national debt and maximum tax rates in very close proximity to what we'll call a "political equilibrium." This change in tax and spending policies is largely what one might expect given the excessively high tax rates and relatively low debt burden that existed in 1981, as compared to our curve defining the "political equilibrium" between the two. We should note however that the reductions in the U.S. national debt in the 1970s were largely achieved through high inflation during this era, as income taxes were not adjusted to account for this factor until the 1980s.
It would seem then that the thing to watch out for in our current situation is how much the national debt increases without a corresponding increase in the top tax rate to close the gap. The farther away from the curve the data moves, the more likely a significant change in income taxes is likely to occur as these three examples demonstrate.
If they don't, then they'll get the money some other way, such as through high rates of inflation. Or both. Let's not underestimate our politicians!
Labels: national debt, taxes, tool
Welcome to the blogosphere's toolchest! Here, unlike other blogs dedicated to analyzing current events, we create easy-to-use, simple tools to do the math related to them so you can get in on the action too! If you would like to learn more about these tools, or if you would like to contribute ideas to develop for this blog, please e-mail us at:
ironman at politicalcalculations
Thanks in advance!
Closing values for previous trading day.
This site is primarily powered by:
CSS Validation
RSS Site Feed
JavaScript
The tools on this site are built using JavaScript. If you would like to learn more, one of the best free resources on the web is available at W3Schools.com.