Going only by age, American teenagers have been the most disproportionately affected group within the United States during the current recession. Our chart below shows just how disproportionately teens have been affected since November 2007:

As our chart indicates, since November 2007, some 758,000 jobs that had been counted as being held by individuals Age 16-19 have been loss, representing 13.4% of the total job loss in the U.S. economy of 5,658,000 through April 2009. By comparison, those Age 16-19 account for 5,103,000 out of the 141,007,000 individuals counted among the total U.S. civilian labor force in April 2009, or 3.6%.
That indicates that through April 2009, teens are 3.7 more likely than their representation within the total civilian labor force would otherwise suggest to have been affected by the loss of jobs for those within their age group.
But, unlike every other age group in the U.S., the number of teen jobs has been progressively falling since peaking in 2006. The chart below shows how the average number of jobs held by teens has changed each year since January 2006 (the average shown for 2009 is through April 2009):

Looking at the average number of jobs held by individuals Age 16-19 between the year of 2006 and the first four months of 2009, we see that over one million jobs for teenagers have disappeared from the U.S. economy.
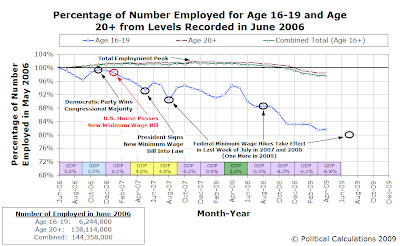
The chart above also confirms that June 2006 marked the peak of teen employment, with some 6,244,000 individuals Age 16-19 recorded as having jobs in that month. Our next chart presents how the number of teens with jobs has changed since then, as a percentage of their June 2006 figure:

Here, we see that as of April 2009, teen employment is just 81.7% of its June 2006 peak value. We also see that it has only been since December 2008 that the number of those Age 20 and higher has dropped below 100% of their June 2006 level.
Labels: jobs, minimum wage
Welcome to the blogosphere's toolchest! Here, unlike other blogs dedicated to analyzing current events, we create easy-to-use, simple tools to do the math related to them so you can get in on the action too! If you would like to learn more about these tools, or if you would like to contribute ideas to develop for this blog, please e-mail us at:
ironman at politicalcalculations
Thanks in advance!
Closing values for previous trading day.
This site is primarily powered by:
CSS Validation
RSS Site Feed
JavaScript
The tools on this site are built using JavaScript. If you would like to learn more, one of the best free resources on the web is available at W3Schools.com.