On Valentine's Day 2011, we explored the correlation that appears to exist between what motor gasoline prices are today and what the unemployment rate will be two years from now. At the time, we found that:
While the correlation is far from a perfect match, what we do see suggests that Americans can indeed use the real price of gas at the pump to reasonably anticipate how the unemployment rate will change two years down the road.
We then went on to create a tool where anybody can plug in the average price of gasoline today to forecast the U.S. unemployment rate two years later (we later simplified the tool, which is currently featured at the top of our website in our "Good Morning, White House Staffer" feature.)
At the time, we offered a vision of two possible scenarios based on the U.S. Energy Information Administration's projections of average U.S. motor gasoline prices that would play out through the end of 2012 (emphasis ours):
For example, using the default data for our tool, which takes the average retail price of motor gasoline in the United States from 21 February 2011 and pairs it with the Consumer Price Index for All Urban Consumers (CPI-U) from January 2011, our tool projects that the unemployment rate will be about 8.3%, which is lower that the 9.0% unemployment rate reported in January 2011, suggesting a mild improvement from now until then.
However, if average gasoline prices rise quickly to exceed $3.50 per gallon across the nation, as they already have in California, our tool would project that no significant improvement in the U.S. unemployment rate will take place over the next two years.
This year, we've watched the second scenario take hold. What's more, those higher gasoline prices have forced the White House to alter its view of how the U.S. economy will perform through the end of 2012 (emphasis ours, again):
President Obama's mid-session budget review confirms what most private and government projections have recently concluded -- that the economy is considerably weaker than earlier forecasts held, and won't fully recover from the Great Recession for years.
Most troubling, both for the country and for Obama politically, is that near-term unemployment is expected to remain significantly higher than expected, averaging 9 percent in fiscal year 2012.
Obama's budget office initially calculated its economic forecast based upon data available through June. Even that data presaged an 8.8 percent average unemployment rate in 2011 and an 8.3 percent average rate next year. But the mid-session review got delayed, and when the Office of Management and Budget revised it to incorporate the data through the end of August, the picture became much gloomier. Unemployment will average 9.1 percent this year, and 9.0 percent next year, OMB concluded, and won't dip below 7 percent until 2015 at the earliest.
Don't those numbers look familiar! Our site's "Good Morning, White House Staffer" feature would appear to be attracting its target audience!
But they would really rather you not think the much higher-than-they-expected unemployment rate they now expect through the end of 2012 has anything to do with the average retail price of gasoline in the United States:
The revised figures "reflect the substantial amount of economic turbulence over the past two months," OMB says, triggered by the European debt crisis, the earthquake in Japan, congressional brinkmanship over the debt ceiling among others. They also take into account the fact that GDP growth in the first half of fiscal year 2011 turned out to be significantly lower than originally thought.
Because that would mean having to admit that the higher-than-expected gasoline prices that we've seen this year are not so much an accident, but rather, a signature achievement of an administration that has consistently sought to increase gasoline prices in the U.S.:
Odd that the Obama administration wouldn't want to trumpet or draw attention to the successful achievement of another one of the President's major domestic policy objectives.
Instead, the President is becoming increasingly desperate as he tries to force the U.S. Congress to pass another massive stimulus package to try to "create or save" more jobs that even his party's leaders in the Senate are hesitant to take up.
Because maybe, just maybe, those White House staffers have finally worked up their own chart showing the correlation of average U.S. gasoline prices and the U.S. unemployment rate two years later, and realized that it looks like this:
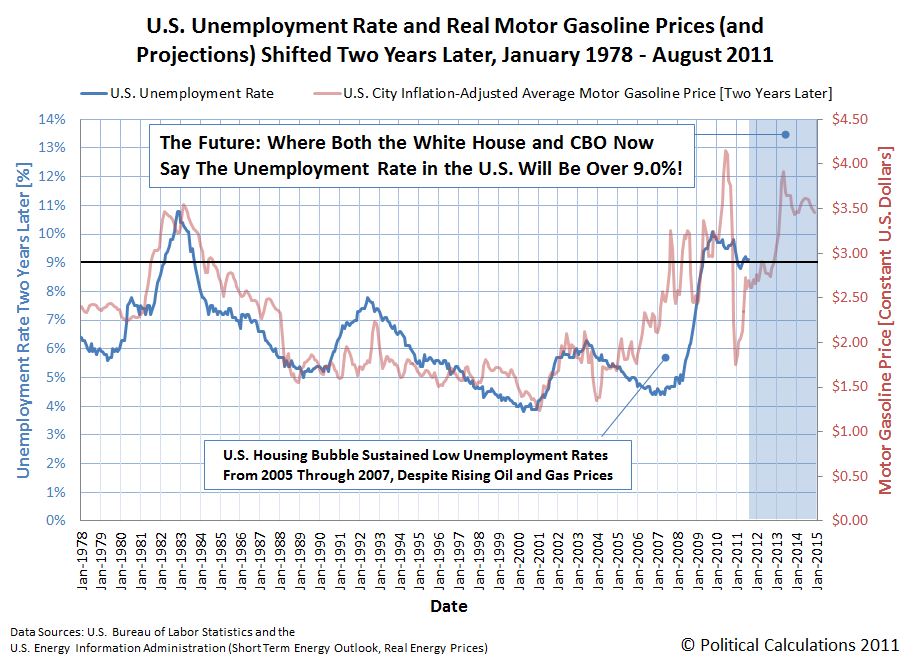
Going by the elevated motor gasoline prices that have come to characterize Barack Obama's years as U.S. President, it appears that the U.S. unemployment rate will skyrocket up to 11% early in 2013 if the correlation between gasoline prices and the unemployment rate two years later continues to hold.
Regardless, whoever wins the Presidential election in November 2012 is going to have their work cut out for them in cleaning up what looks to be one big man-caused disaster.
Data Sources
U.S. Energy Information Administration. Short-Term Energy Outlook - Real Energy Prices. [Excel spreadsheet - monthly real U.S. City Average Motor Gasoline Prices]. Accessed 14 September 2011.
U.S. Bureau of Labor Statistics. Labor Force Statistics from the Current Population Survey, LNS14000000, Seasonally-Adjusted Unemployment Rate. Accessed 14 September 2011.
Previously on Political Calculations
- Surprising Impotence
- Who's Behind the Drop in Gas Prices?
- Changing the Outlook for Oil Prices
- Holy Gas Prices Batman! It's the New Batmobile!...
- Using Gas Prices to Forecast the Unemployment Trend
- Correlating the Price of Gas and the Unemployment Rate
- Why Are Americans Driving Less?
- How Much Does Your Commute Cost You?
- Should You Move Closer to Work to Save Commuting Costs?
- How to Save Money on Gas, Without Driving Less
- How Much Are Higher Gas Prices Really Hurting You?
- Should You Trade in Your Gas Guzzler?
- Is It Worth the Drive?
- Do Hybrids Really Save Money?
- How Much Do You Pay in Gas Taxes?
Labels: forecasting, gas consumption, unemployment
Welcome to the blogosphere's toolchest! Here, unlike other blogs dedicated to analyzing current events, we create easy-to-use, simple tools to do the math related to them so you can get in on the action too! If you would like to learn more about these tools, or if you would like to contribute ideas to develop for this blog, please e-mail us at:
ironman at politicalcalculations
Thanks in advance!
Closing values for previous trading day.
This site is primarily powered by:
CSS Validation

RSS Site Feed
JavaScript
The tools on this site are built using JavaScript. If you would like to learn more, one of the best free resources on the web is available at W3Schools.com.
Other Cool Resources
Blog Roll


