to your HTML Add class="sortable" to any table you'd like to make sortable Click on the headers to sort Thanks to many, many people for contributions and suggestions. Licenced as X11: http://www.kryogenix.org/code/browser/licence.html This basically means: do what you want with it. */ var stIsIE = /*@cc_on!@*/false; sorttable = { init: function() { // quit if this function has already been called if (arguments.callee.done) return; // flag this function so we don't do the same thing twice arguments.callee.done = true; // kill the timer if (_timer) clearInterval(_timer); if (!document.createElement || !document.getElementsByTagName) return; sorttable.DATE_RE = /^(\d\d?)[\/\.-](\d\d?)[\/\.-]((\d\d)?\d\d)$/; forEach(document.getElementsByTagName('table'), function(table) { if (table.className.search(/\bsortable\b/) != -1) { sorttable.makeSortable(table); } }); }, makeSortable: function(table) { if (table.getElementsByTagName('thead').length == 0) { // table doesn't have a tHead. Since it should have, create one and // put the first table row in it. the = document.createElement('thead'); the.appendChild(table.rows[0]); table.insertBefore(the,table.firstChild); } // Safari doesn't support table.tHead, sigh if (table.tHead == null) table.tHead = table.getElementsByTagName('thead')[0]; if (table.tHead.rows.length != 1) return; // can't cope with two header rows // Sorttable v1 put rows with a class of "sortbottom" at the bottom (as // "total" rows, for example). This is B&R, since what you're supposed // to do is put them in a tfoot. So, if there are sortbottom rows, // for backwards compatibility, move them to tfoot (creating it if needed). sortbottomrows = []; for (var i=0; i
Last week, the U.S. Census Bureau issued the latest data it collects on the balance of trade of goods and services between the United States and China. The chart below shows what we find when tracking the year-over-year growth in the amount of U.S. imports from China and U.S. exports to China from January 1985 through September 2011, which provides an indication of the relative economic health of both nations.
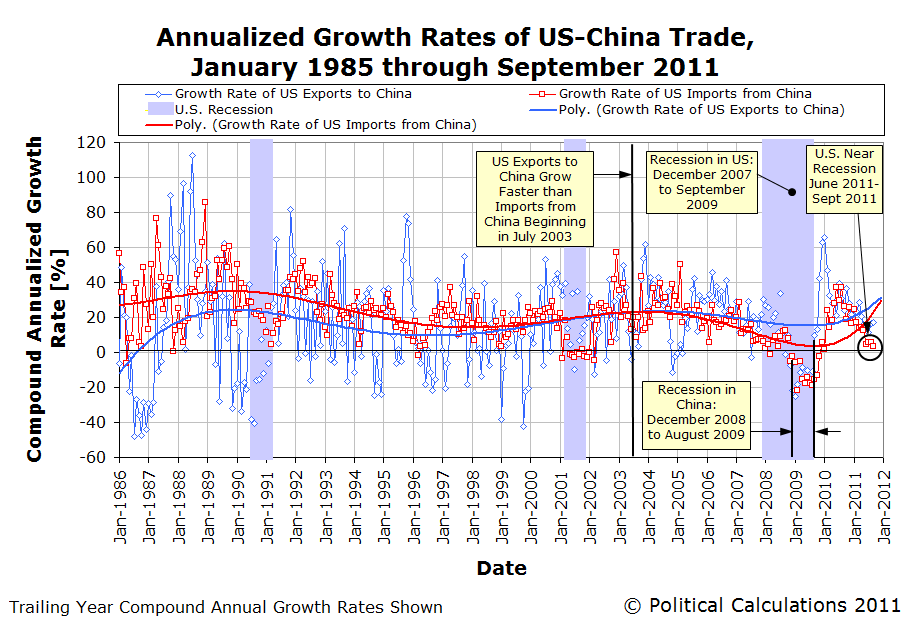
What we find in the chart above is that the rate of growth of what the U.S. imports from China was very low in September 2011, at what we would describe as being "near-recessionary" values, continuing the pattern we've been observing since June 2011.
This indicates that the economic sluggishness most people perceived during the summer of 2011 was real, because a growing economy would tend to pull in more imports.
But we also see that China's economy is also going through its own slowdown, although it appears to still be growing more strongly than the U.S. economy.
Switching over to our doubling rate charts, we see that U.S. exports have sustainably doubled in value four times since January 1985, and are nearing the fifth doubling line:
We observe that the pattern of U.S. export to China since 2008 is very different from the preceding 23 years - it appears as though U.S. exports to China have begun following a seasonal pattern, with the peak in exports occurring in December.
Meanwhile, we find that China's exports to the United States have been growing at a much slower pace since 2008:
The U.S.' imports from China typically follow a seasonal pattern, with the peak occurring between the months of August through October, which coincides with the stocking of consumer goods for the Christmas shopping season in the United States. Although the value of the goods and services the U.S. imports from China is at near record levels (they hit an all-time high in August 2011), the quantity of goods being imported from China into the U.S. is falling.
So how can the value of what the U.S. imports from China be near its all-time record while the volume of goods being shipped is falling? Easy! It's because the value of the U.S. dollar is falling with respect to the value of China's currency:
To put it bluntly, the falling value of the dollar is making it relatively more expensive to buy imports from China than it was a year ago. And that's why U.S. port traffic is down, and U.S. port employees are working less, even though the U.S. appears to be spending more money on Chinese imports this year as compared to last.
And most paradoxically, President Obama is demanding China do more to allow the U.S. dollar to fall with respect to the Chinese yuan, even though it's clearly already happening and is producing the effects he desires.
But then, it's not like President Obama pays much attention to serious economic matters of any kind, unless they reinforce his mispreconceptions.
Image Credit: The Economist
Labels: trade
Welcome to the blogosphere's toolchest! Here, unlike other blogs dedicated to analyzing current events, we create easy-to-use, simple tools to do the math related to them so you can get in on the action too! If you would like to learn more about these tools, or if you would like to contribute ideas to develop for this blog, please e-mail us at:
This year, we'll be experimenting with a number of apps to bring more of a current events focus to Political Calculations - we're test driving the app(s) below!
The S&P 500 at Your Fingertips
The Distribution of Income for 2010: Individuals
Should You Trade in Your Gas Guzzler?
What Are the Chances Your Marriage Will Last?
Tipping Around the World
What's Your Body Fat Percentage?
The Odds of Dying, Again!
Gas Prices, the Unemployment Rate, and Desperation
Hauser's Law
The Real Story Behind "Rising" U.S. Income Inequality
First Time Visitor to Political Calculations?
On the Moneyed Midways
A Lot, But Not All, of Our Tools
Political Calculations' U.S. GDP Temperature Gauge provides a means to quickly evaluate the growth rate of the U.S. economy against the backdrop of how the economy has performed since 1980, with the "temperature" color spectrum ranging from a recessionary "cold" (purple) through an expansionary "hot" (red).
The GDP Temperature Gauge presents both the annualized GDP growth rate as reported by the U.S. Bureau of Economic Analysis reports for a one-quarter period and also as averaged over a two quarter period, which smooths out the volatility seen in the one-quarter data and provides a better indication of the relative strength of the U.S. economy over time.
This site is primarily powered by:
Visitors since December 6, 2004:
The tools on this site are built using JavaScript. If you would like to learn more, one of the best free resources on the web is available at W3Schools.com.
ZunZun - Exceptional regression analysis tool.
Wolfram Integrator - Solve integrals. Do calculus!
Create a Graph - Easy-to-use basic graph-making tool.
Many Eyes - Data visualization extraordinaire!
Wolfram Alpha - Computational knowledge engine.
Khan Academy - Math & science video mini-lectures!
Picasion - Animate images.
Bloodhoundblog
Budgets Are Sexy
Cafe Hayek
Carpe Diem
Core77
Coyote Blog
Craig Harper
Darwin's Finance
Digerati Life, The
Division of Labour
Dough Roller, The
Eclectecon
Econlog
Economics Roundtable
EconomicsUK
Environmental Economics
Escape from Cubicle Nation
Execupundit
FiscalGeek
Get Rich Slowly
Gongol
Good Financial Cents
HR Bartender
Hot Air
i4cp Productivity
Innocent Bystanders
Innovation and Growth
Instapundit
Intangible Economy
I've Paid Twice for This Already
Joanne Jacobs
Kaus Files
Len Penzo dot Com
Making Ripples
Market Power
Mechonomics
Mighty Bargain Hunter
Monevator
My Dollar Plan
New Economist
Newmark's Door
Nina Simosko
Physorg
Private Sector Development
Real Clear Politics
Richard Fernandez
Roger L. Simon
Rowan Manahan
Sound Politics
SOX First
Sports Economist, The
squawkfox
Three Star Leadership
Tim Worstall
Townhall
Trusted Advisor
Uncommon Misperceptions
voluntaryXchange
WILLisms
Winterspeak
Big Picture, The
Crackerjack Finance
CXO Advisory Group
Disciplined Approach to Investing
Dividend Guy, The
Doug Short
Evidence Investing
Fat Pitch Financials
FX Investment Strategies
Oilprice
American Red Cross
Children's Heart Foundation
Salvation Army
SMA Foundation
Kindle Paperwhite 3G - Best e-reader!
Angel in the Whirlwind
Bailout Nation
Cartoon Guide to Statistics
A Comprehensive Guide to the Peloponnesian War
The Complete Personal Memoirs of Ulysses S. Grant
The Count of Monte Cristo
Ender's Game
Gardner's Art Through the Ages
Empire of Wealth
How to Make Presentations to Councils and Boards
Juran's Quality Handbook
Marks' Standard Handbook
The Second World War
Stocks for the Long Run
Why Smart Executives Fail
The Tudors: The Complete Series
Kindle Fire HD 8.9" 4G LTE Wireless 32 GB
Snap Circuits Jr. SC-100
Nerf Vortex Praxis
Sony BRAVIA 40" LED HDTV
2540 Series Docking Station
New Balance MX623
Dunham Men's Waterproof Oxford
TN360 Black Toner Cartridge
The Dangerous Book for Boys
Air Swimmer Remote Control Inflatable Flying Shark
Fisher-Price Little People Lil Pirate Ship