Would you believe that the same math that describes how predators in the animal kingdom stake out their territory can be used to identify the boundaries between the turf claimed by rival gangs? The evidence comes from the UCLA Newsroom:
A mathematical model that has been used for more than 80 years to determine the hunting range of animals in the wild holds promise for mapping the territories of street gangs, a UCLA-led team of social scientists reports in a new study.
"The way gangs break up their neighborhoods into unique territories is a lot like the way lions or honey bees break up space," said lead author P. Jeffrey Brantingham, a professor of anthropology at UCLA.
Further, the research demonstrates that the most dangerous place to be in a neighborhood packed with gangs is not deep within the territory of a specific gang, as one might suppose, but on the border between two rival gangs. In fact, the highest concentration of conflict occurs within less than two blocks of gang boundaries, the researchers discovered.
The math the UCLA researchers used is the Lotka-Volterra equations, which were developed in the 1930s to describe how predator and prey species interact over time. The UCLA press release explains what the math describes:
The equations are based on the principle that competition between groups determines where the boundaries between rivals form, and even a tiny amount of competition is enough to cause territories to form.
"What's at work is a competitive balancing act where both gangs are trying to keep their rival as far away as possible," Brantingham said.
The model the researchers derived from the equation predicted that gang boundaries would form midway between the home bases of rivals and would run in a perpendicular line between them.
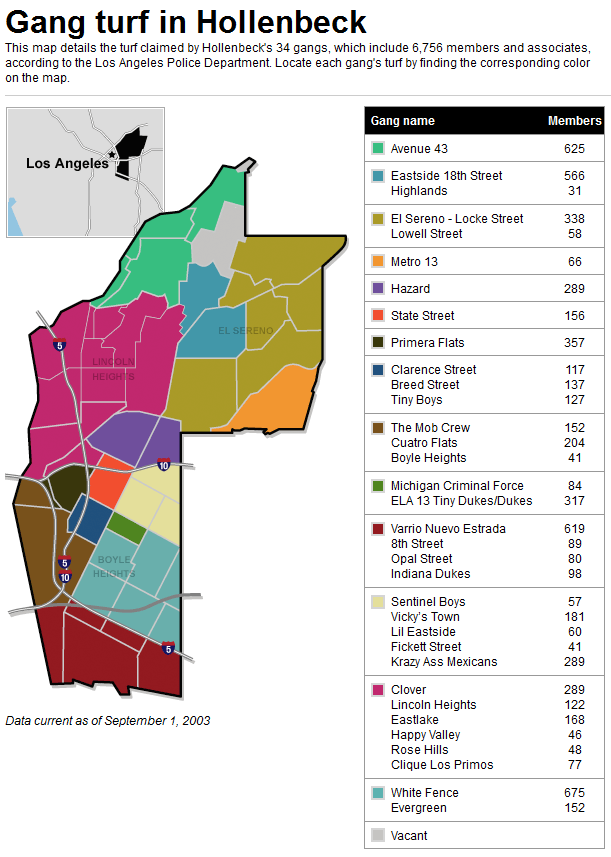
Seems pretty straightforward and simple, right? Let's see how the study fared when real world data from Boyle Heights, an area within Los Angeles' Police Department's Hollenbeck division, was considered:
The team looked at 13 gangs in the 6.5-square-mile area of Boyle Heights, a densely populated neighborhood on Los Angeles' east side that is bounded by three freeways. Gang activity tends to be confined within the freeway-bounded area.
To determine the home bases for each gang, the researchers relied on a prior study by Tita and his UC Irvine colleagues. The locations of the home bases ranged from a specific street corner to someone's house, a neighborhood business or any other specific location where a gang gathers most frequently.
Using the Lotka–Volterra formula, Brantingham's team drew boundaries between the known gangs. Unlike law enforcement's maps, the resulting effort did not produce gang boundaries that neatly followed streets. Instead, the boundaries ran through the yards of homes and businesses and through alleyways. When the boundaries did land on streets, they were as likely to crisscross them as follow them.
Here's an example of the map UCLA's social scientists produced (excerpted from here):

Note how different it is from CNN's 2003 map of the area's gang territories, which closely follows streets.
Now, mapping out where gang crime actually occurred in the years from 1999 through 2002:
Using police records, the researchers then mapped 563 known gang crimes that occurred between 1999 and 2002 and have been attributed by police to at least one of the 13 gangs. To their surprise, most of the crimes fell on the borders that the model laid between gang territories. When crime locations did deviate from the borders, they did so in a configuration that was consistent with the model. For instance, the theory predicted that 58.8 percent of the crimes would occur within one-fifth of a mile of the border between two gangs — or just under two blocks — and 87.5 percent within two-fifths of a mile of the border — or just over three blocks. Overall, 99.8 percent of crimes could be expected to occur within one mile of the border, according to the theory.
Reality turned out to be pretty close to the theory:
In fact, the team found that 58.2 percent occurred within two blocks of the border and 83.1 percent within just over three blocks of the border; in total, 97.7 percent of the crimes took place within one mile of the border between gangs.
It's like economics in a way - the most significant activity happens at the margins. But here, the typical transactions involve assault and murder. The areas closest to these margins, or boundaries between territories controlled by different gangs, account for over half of all gang crime recorded between 1999 and 2002!
More interestingly though, we find that its the competition between adversaries that defines where the boundaries between them form, rather than vice versa.
Elsewhere on the Web
Jeff Brantingham, one of the study's authors, has put other mathematical models to work to map out areas where burglars are most likely to be operating. The early results suggest that applying the math to direct police patrols may have reduced burglaries in some areas of Los Angeles by as much as 25%.
References
Brantingham, P. J., Tita, G. E., Short, M. B. and Reid, S. E. (2012), The Ecology of Gang Territorial Boundaries. Criminology. doi: 10.1111/j.1745-9125.2012.00281.x. 25 June 2012. [Ungated Version: Adaptation of an Ecological Territorial Model to Street Gang Spatial Patterns in Los Angeles.]
Labels: crime, data visualization
Welcome to the blogosphere's toolchest! Here, unlike other blogs dedicated to analyzing current events, we create easy-to-use, simple tools to do the math related to them so you can get in on the action too! If you would like to learn more about these tools, or if you would like to contribute ideas to develop for this blog, please e-mail us at:
ironman at politicalcalculations
Thanks in advance!
Closing values for previous trading day.
This site is primarily powered by:
CSS Validation

RSS Site Feed
JavaScript
The tools on this site are built using JavaScript. If you would like to learn more, one of the best free resources on the web is available at W3Schools.com.
Other Cool Resources
Blog Roll


