Now that we've tested our median income extraction math upon the U.S. Census' income data for women, we're going to repeat the exercise today for the Census' income data for men.
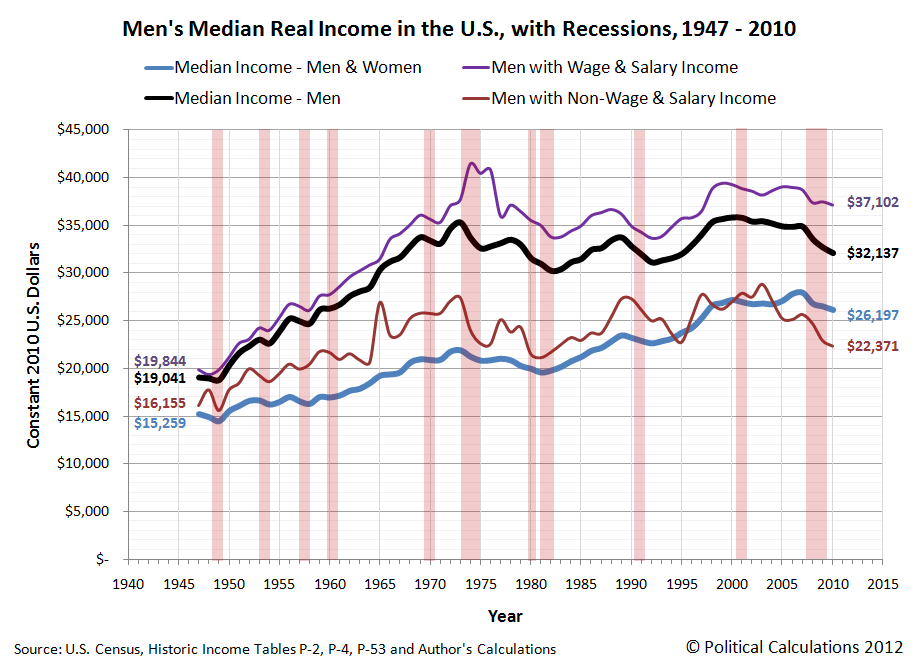
Our chart below shows what we found when we generated the inflation-adjusted median income data for both wage or salary earning men and what we extracted from the data for non-wage or salary earning men from the Census' Current Population Survey results for each year from 1947 through 2010, expressed in terms of constant 2010 U.S. dollars:
The chart is very different from what we observed for women. Starting first with the Census' published data for men with wage and salary income, we see that men just more than doubled their inflation-adjusted wage and salary incomes from 1947 through 1974, rising from $19,844 to just over $41,400, which corresponds to a real annualized growth rate of 2.6%.
But after that, men's median wage and salary income nose-dived in 1977 to a level around $35,000, plus or minus $2,000, about which it stagnated for the next twenty years. In 1997, it jumped up to a level around $38,000, about which it stagnated again in a range within $2,000 of that mark.
We should note at this point that the Census' data only counts money income - it does not include non-monetary compensation, such as health insurance benefits, that individuals earning wage or salary income commonly enjoy.
The more remarkable story though is for men with non-wage and salary income.
Here, we observe that men in this category had a much more slowly rising median income in the years from 1947 through 1965, increasing from an inflation-adjusted level of $16,155 to just $20,654, for a real annualized growth rate of just 1.4%.
In 1965 though, we find that non-wage or salary income earning men had a sudden jump to nearly $27,000 in their median incomes, after which we observe that this value has since settled into a range centered about $25,000, plus or minus $4,000 for all the years since.
That was surprising to us because we had expected that the median income data for this group would follow the same pattern we had observed earlier for women: basically flat up until after 1965, when the launch and growth of the U.S. government's Medicaid and Medicare programs might provide a steadily rising source of income for non-wage or salary earning men.
Instead, we find that other than what might be described as a one-time only benefit, the median income for men with non-wage or salary income has essentially stagnated since 1965.
We also find that non-wage or salary earning men would seem to be much more vulnerable to periods of recession than their wage and salary earning counterparts. Generally speaking, they see much deeper and longer periods of declines in their median incomes, indicating greater levels of economic distress.
We should note here that our non-wage or salary earning men include those who earn income from self-employment or through investments, which might account for much of that apparent greater sensitivity to economic downturns.
Labels: data visualization, demographics, income
Welcome to the blogosphere's toolchest! Here, unlike other blogs dedicated to analyzing current events, we create easy-to-use, simple tools to do the math related to them so you can get in on the action too! If you would like to learn more about these tools, or if you would like to contribute ideas to develop for this blog, please e-mail us at:
ironman at politicalcalculations
Thanks in advance!
Closing values for previous trading day.
This site is primarily powered by:
CSS Validation
RSS Site Feed
JavaScript
The tools on this site are built using JavaScript. If you would like to learn more, one of the best free resources on the web is available at W3Schools.com.
