First the good news: we can now peer ahead to the end of the third quarter of 2013 and see what is in store for the quarterly dividends of the S&P 500! The chart below reveals what we see in that future:

Taking the change in dividends over time as a good measure of the health of the U.S. economy, 2013 thus far appears to be destined for spectacularly lackluster growth, as dividends would seem to be set to stall out during the year, losing the momentum they've sustained since mid-2010.
Here, instead of increasing at a year-over-year rate of anywhere from $0.84 to $1.49 per share as they have since mid-2010, the S&P 500's dividends from the third quarter of 2012 to the third quarter of 2013 would appear to be set to rise by just $0.56 per share. At this writing, that low figure indicates that investors expect a rather dramatic slowdown in the economy to take place by the third quarter of 2013.
To put that observation into a larger context, our next chart shows the S&P 500's quarterly cash dividends per share going back for each quarter since 1988-Q1. Why only go back to this quarter? That's because the first quarter of 1988 is as far back as Standard and Poor provides this data in quick and easy to access spreadsheet format!
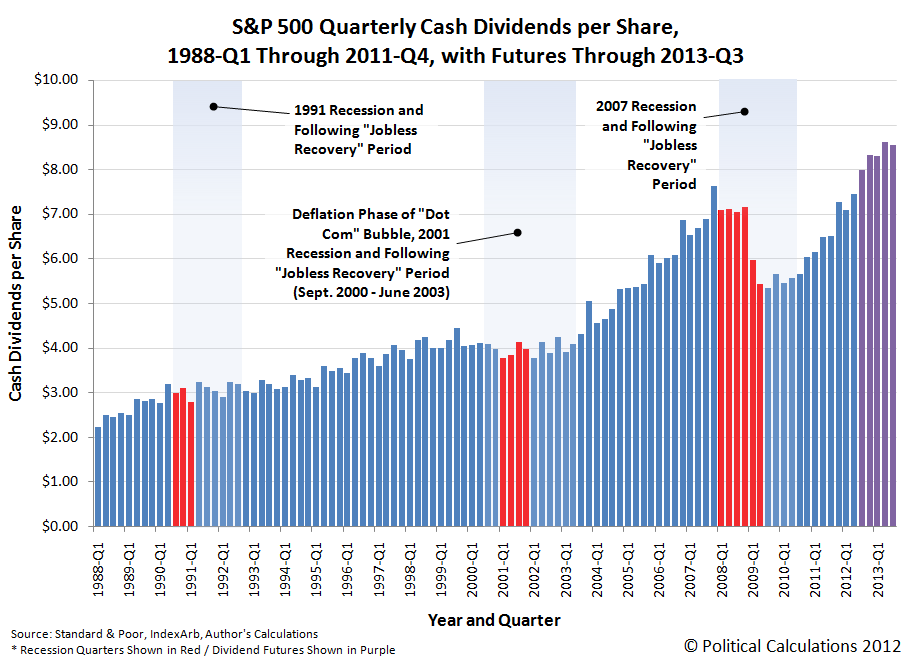
Here, we see that what happens with the S&P 500's quarterly dividends provides a pretty good indication of what's going on with the U.S. economy, and in particular the U.S.' employment situation, as growing levels of dividends generally correspond with a growing job market, while falling or flat dividend levels correspond with a poor job market.
Even falling dividend levels from a previous quarter correlate to periods of poor economic performance in the U.S., which we've referred to as microrecessions. And from this vantage point, 2013 would appear to be set to have at least two of them during the year. Or maybe that's just us being optimistic in our reading of the data....
That, of course, assumes that the future will play out as investors currently expect. As best as we can tell, there is clearly not much optimism for the fate of the economy going into 2013.
Welcome to the blogosphere's toolchest! Here, unlike other blogs dedicated to analyzing current events, we create easy-to-use, simple tools to do the math related to them so you can get in on the action too! If you would like to learn more about these tools, or if you would like to contribute ideas to develop for this blog, please e-mail us at:
ironman at politicalcalculations
Thanks in advance!
Closing values for previous trading day.
This site is primarily powered by:
CSS Validation

RSS Site Feed
JavaScript
The tools on this site are built using JavaScript. If you would like to learn more, one of the best free resources on the web is available at W3Schools.com.
Other Cool Resources
Blog Roll


