We marked the end of the year-long microrecession in the United States yesterday, so today, we thought we'd check in on two of the lagging indicators of a nation's economic health: trade and jobs.
Our first chart shows how the year-over-year growth rate in the value of goods between the United States and China has been recorded by the U.S. Census Bureau for each month from January 1986 through July 2013. To account for changing currency exchange rates between the two nations, we have adjusted the values so that they are expressed in terms of the "receiving" nation's currency, with the growth rate of U.S. exports to China being based on the value of those goods expressed in yuan, and the growth rate of U.S. imports from China being based on the value of those goods expressed in U.S. dollars:

We find that both nations would appear to be have been experiencing sluggish rates of growth for the last several months. Looking just at July 2013, China's economy would appear to have fallen into recessionary territory for the third time since March 2013, as the pace of economic growth within that nation would not appear sufficient to increase its demand for the goods it imports from the U.S. Likewise, the pace at which the U.S. imports goods from China also indicates sluggish economic growth, although this month, it is in positive territory.
The sluggish growth rates observed in the past several months is not surprising given that the U.S. has only just exited a period of microrecession in August 2013, while China's economy has slowed to a very lackluster pace of growth. Since the decisions of what volume of goods to ship overseas is made many months in advance of their arrival at their destination nation's ports, which depends upon the business conditions observed at the time the decisions are made, what these growth rates are communicating are the economic conditions that existed in the respective nations several months ago.
Like international trade, jobs, as measured by the number of employed, also tend to lag behind real changes in the economy. The chart below shows how the number of employed Americans by select age groups has changed since the total number of employed Americans peaked in November 2007, just ahead of the so-called "Great Recession", through August 2013:

If you look at the data at the beginning of the Great Recession, we see that there was very little job loss at the very beginning, and no job loss outside of teens and young adults (Age 16-24) until April 2008, five months after the official start of the 2007 recession.
To take that lag effect for jobs into account, we'll use November 2012 as our start month for measuring changes in the number of employed in the U.S., since that would be five months after our dividend data first indicated the U.S. economy was experiencing recessionary conditions back in July 2012. We obtained the following figures for the net change in number of employed from November 2012 through August 2013 for each of the following age groups we regularly track:
- Teens (Age 16-19): -58,000 (from 4,468,000 in November 2012 to 4,410,000 in August 2013)
- Young Adults (Age 20-24): -52,000 (from 13,595,000 to 13,543,000)
- Adults (Age 25 and Older): +1,003,000 (from 125,214,000 to 126,217,000)
It seems the U.S. economy has been no country for young men, or women, for many months.
Still, with the microrecession just behind us, we would expect to see several more months of lackluster jobs numbers for young Americans before things really pick up as the recovery from the microrecession that ran from July 2012 through July 2013 gets underway.
Perhaps just in time for Christmas!
References
Board of Governors of the Federal Reserve System. China / U.S. Foreign Exchange Rate. G.5 Foreign Exchange Rates. Accessed 11 September 2013.
U.S. Bureau of Labor Statistics. Employment Situation Report Archive. Accessed 11 September 2013.
U.S. Census Bureau. Trade in Goods with China. Accessed 11 September 2013.
Labels: jobs, recession, trade


The number of public U.S. companies announcing that they would be cutting their future dividend payments fell from 20 to 14 in July 2013. While this level of dividend cuts announced in a single month is still consistent with recessionary conditions being present in the U.S. economy, it does represent an improving situation as it appears that the U.S. economy is beginning to exit the microrecession that began back in July 2012.

By our definition, a microrecession represents a period of slow or negative economic growth for the nation that is either too limited in scope, severity or duration to qualify as an official period of recession, as might be determined by the National Bureau of Economic Research.
We'll note that the Bureau of Economic Analysis' recently revised GDP data now confirms what our dividend indicator has been communicating in real time - the pace of economic growth in the U.S. has been in the "cold" recessionary zone, as indicated by our two-quarter GDP growth rate temperature gauge:

Prior to its revision, the BEA's GDP data had indicated that the U.S. economy was growing at a somewhat faster pace.
As best as we can tell, it appears that the microrecession peaked in the fourth quarter of 2012. The U.S. economy would now appear to be exiting this period of microrecession, which has now lasted for over a year.
References
Standard and Poor. Dividend Action Report. [Excel spreadsheet]. Accessed 5 August 2013.
U.S. Commerce Department Bureau of Economic Analysis. Current-Dollar and "Real GDP". [Excel Spreadsheet]. Accessed 31 July 2013. - Note: Inflation-adjusted figures are actually presented in terms of chained 2009 U.S. dollars (not chained 2005 U.S. dollars).
Labels: dividends, recession forecast
Another month, another 15 companies announcing that they'll be paying less out in dividends in the future, making August 2014 the tenth consecutive month in which the number of companies acting to cut their dividends has been elevated above the "Recession Line":

Alternatively, if we ignore the third quarter of 2013, when the number of dividend cutting companies briefly dropped below the Recession Line, we could describe the U.S. economy as having been in microrecession since August 2012, which really makes this past month the two-year anniversary of that economic state. A microrecession might be described as being when recessionary conditions are present in the U.S. economy, but which are too limited in scale, scope or duration to qualify as an official period of recession according to the standards of the National Bureau of Economic Research.
We believe the Federal Reserve's QE 3.0/4.0 programs are directly responsible for preventing the U.S. economy from falling more definitively back into recession during this period. Those economy stimulating programs have been running from September 2012 through the present, coinciding with the U.S. economy's state of microrecession.
Looking back at the dividend data, through August 2014, that now makes 71 U.S. companies that have taken that action in the five months since the U.S. economy contracted sharply during the first three months of 2014, when 91 companies acted to cut their dividends.
Most of the companies that have acted to cut their dividends in 2014 tend to have smaller market capitalizations. According to Standard and Poor (Excel Spreadsheet), just four companies in the S&P 500 have had sustained dividend cuts during 2014:
- CONSOL Energy (NYSE: CNX): From $0.50/share to $0.25/share in February 2014.
- Equity Residential (NYSE: EQR): From $2.60/share to $2.00/share in March 2014.
- FirstEnergy (NYSE: FE: From $2.20/share to $1.44/share in January 2014.
- Newmont Mining (NYSE: NEM: From $0.80/share to $0.10/share (in two steps - a $0.20/share cut in February, followed by a $0.50/share cut in April 2014).
The industries in which these companies are part have been struggling in 2014, which is the principal reason for the lackluster performance of the Russell 2000 index compared to the S&P 500 for the year. The main difference between the small market cap companies of the Russell 2000 and the large market cap companies of the S&P 500 is that the larger companies that make up the S&P's stock market index are better able to weather downturns in their industries and therefore have less of a need to cut their dividends.
Data Source
Standard & Poor. Monthly Dividend Action Report. [Excel Spreadsheet]. Accessed 5 September 2014.
Labels: dividends, recession, stock market

As we've long forecast, the BEA's third estimate of GDP for the second quarter of 2012 has confirmed that the U.S. economy is at least experiencing a microrecession. To see what we mean, our temperature charts on the right show the annualized one-quarter and two quarter-long growth rates for GDP shows how the most recent three quarters for GDP fit among the backdrop of the typical levels of GDP recorded during the past 30 years.
In the charts, the indicated temperature spectrum runs from the red "hot" zone, which indicates the kind of "heated" economic growth that might push the Federal Reserve to adopt policies aimed at slowing down the growth of the economy, through the green "comfortable" zone, on down to the purple "cold" or recessionary zone.
Through 2012-Q2, we see that the GDP growth rate has dipped into the "cold" zone indicating lackluster or near-recessionary level growth for the one-quarter side of our temperature chart, with an annualized growth rate of 1.3%. On the less volatile two-quarter temperature chart, we see that the U.S. economy is right at the margin dividing the "cool" and "cold" zones, right at an annualized growth rate of 1.6%.
Both results confirm that the U.S. economy in 2012-Q2 at least qualifies as having been in microrecession, which might be described as a recession that is either of too short duration or one that's perhaps too small in scope or severity to qualify as an outright national recession.
Will that continue into the third quarter of 2012? The one that just ended on 30 September 2012?
We'll take on that question tomorrow, when this link becomes active!
Labels: gdp
Thanks to the Fed's excursion into Zero Interest Rate Policy (aka "ZIRP"), we can't use our dedicated tool that reckons the odds of a recession up to a year in the future.
But we can do the next best thing and listen to what the stock market is trying to tell us:

Here, we find that the private sector of the U.S. economy is set to slow down in a big way going into the second quarter of 2012, which we see as the decrease in that quarter's expected dividends per share.
Keep in mind the extremely slow growth of just once cent per share from the second to third quarters of 2011 directly coincided with what we've described as a microrecession in the United States, which we've since confirmed using international trade data.
But what does that mean for jobs? After all, as we've seen previously, the big job losses following the beginning of a recession often occur quite a bit after it has begun.
Fortunately, we have another tool we can use to predict how the U.S. unemployment rate will change, up to two years in the future! The relationship between inflation-adjusted motor gasoline prices and the unemployment rate in the U.S.!

Here, we've shifted the red curve indicating the level of real motor gasoline prices in the U.S. some two years into the future. Here, we see that the recently announced unemployment rate of 8.6% for the U.S. is right about exactly where the gas prices of two years ago would predict they would be.
(Technically, they had been higher than anticipated until the most recent employment situation report, but then, remember the U.S. went through that whole microrecession thing!)
Looking into the future, we see that the unemployment rate through 2012 is likely to fall into the range between 8.5% and 9.0%. But very early in 2013, it would seem set to skyrocket back up over the 10% mark, after beginning to rise sharply toward the end of 2012.
That won't be any microrecession. And now, you can't say you weren't warned about what now looks like is coming this way!
Elsewhere on the Web
Doug Short compares the track record of two leading economic indicators and notes that the two have diverged in recent months, with one signalling recession and the other chirping along merrily - only one can be right!...
Labels: recession forecast
With the United States having entered into microrecession in the first half of 2011, the next logical question to ask is whether that economic condition will turn into a full blown recession?
To find out, we applied our forward-looking GDP forecasting tool to project where GDP will likely be in the third quarter of 2011. The chart below illustrates our results:

Using the advance estimate of inflation-adjusted GDP for the second quarter of 2011 ($13,270.1 billion in chained 2005 U.S. dollars), our "Modified Limo" forecasting method anticipates that real GDP will rise to be within 2% of $13.3 trillion in the third quarter of 2011.
We estimate there is a 68% likelihood that real GDP in 2011Q3 will be recorded as being somewhere between $13,157.6 billion and $13,436.9 billion, with growth from the current advance estimate value of $13,270.1 billion being slightly favored.
As such, we don't expect that the current microrecession will grow to become a full blown recession at this time.
Labels: gdp forecast
After stalling out in March 2012, the employment situation for April 2012 in the U.S. faded across the board.
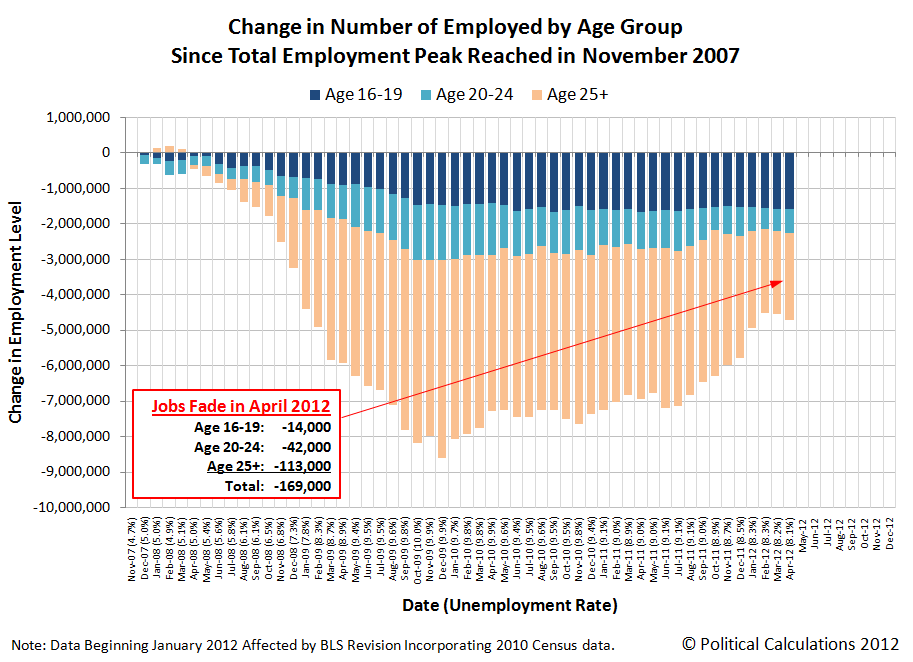
We see that for all the age groups we routinely cover. The number of teens (Age 16-19) recorded as having jobs fell by 14,000 from the level recorded in March 2012 to 4,321,000 in April 2012. Likewise, young adults between the ages of 20 and 24 saw their numbers fall by 42,000 to 13,329,000 in April 2012, while those Age 25 or older saw their numbers in the U.S. civilian workforce decline for the first time since October 2011, falling by 113,000 to 124,215,000.
Compared to November 2007, when the total employment level in the United States peaked just before the peak in economic expansion marking the beginning of recession in the following month, there are 4,730,000 fewer individuals being counted with jobs as of April 2012. There were 141,865,000 people counted as being employed in April 2012.
Of the decline in jobs since November 2007, just over 1 out of 3 of the jobs that have disappeared from the U.S. economy in the time since may be accounted for by individuals between the ages of 16 and 19. Today, these individuals represent 3.0% of the entire U.S. workforce, down from a percentage share of 4.0% in November 2007.
Another 1 out of 7 of the decline in jobs since November 2007 may be accounted for by young adults (Age 20-24). These individuals represent 9.4% of the total U.S. workforce today, which is almost identical to their percentage share of 9.5% in November 2007.
The remainder of the decline in jobs since November 2007 is obviously accounted for by those Age 25 or older, who account for 51.8% of the decline in jobs. Unlike teens and young adults however, the percentage share of these adults in the U.S. civilian labor force has risen to represent 87.6% (just over 7 out of 8) of all working Americans), which is up from 86.5% in November 2007.
The April 2012 jobs report is consistent with what we would describe as a microrecession, which we first forecast for this quarter in June 2011.
By our definition, a microrecession is a period of relatively slow or negative economic growth for a nation that is either relatively minor (say of limited scope, affecting some but not all regions across a country) or is comparatively short in duration.
We continue to anticipate that the U.S. economy will not enter into a full blown recession in 2012, and will rebound in the third and fourth quarters of 2012. We do not anticipate at this time that this expected rebound will extend very far into 2013.
Labels: jobs, recession forecast
Last Friday, the U.S. Bureau of Economic Analysis revised its real GDP data going back to the start of the 2007 recession. Our animated chart below, created with the Make a GIF online app, shows what changed:

We added the horizontal line indicating the peak of the previous period of economic expansion, which helps highlight the biggest change: instead of having reached and passed that previous peak in the fourth quarter of 2010, the new data indicates that inflation-adjusted GDP in the U.S. is stalling out well below that level.
So, instead of the U.S. economy generating $13,444.3 billion (in 2005 U.S. dollars) of economic activity in the first quarter of 2011, it is actually 1.6% smaller than previously thought, having generated $13,227.9 billion (in 2005 U.S. dollars).
This revision for the first quarter of 2011 marks the largest deviation from previously reported GDP data, coming in some $216.4 billion below the earlier recorded levels.
We also see that the U.S. economy performed far worse than previously thought at the depth of the recession in the fourth quarter of 2009 and the first quarter of 2010. The deviation from previously reported data for both quarters is respectively $205.5 billion and $201.1 billion less than the values that were presented by the BEA before the 30 July 2011 GDP revision.
But the first quarter's deviation of $216.4 billion from the previously reported level is extremely serious. Adding in the advance estimate for the level of GDP in the second quarter of 2011, here is what the one-quarter annualized GDP growth rate and the two-quarter annualized GDP growth rate looks like on our GDP Temperature Gauge charts, which projects the most recently recorded growth rates of GDP against a temperature spectrum indicating the typical levels of GDP recorded since 1980:
 |
 |
Of these two charts, the less volatile Two-Quarter GDP Growth Rate Temperature Gauge, which considers the annualized growth rate of GDP over the preceding two quarters and which is useful in forecasting future GDP levels, has fallen into the purple "cold" range of our GDP temperature spectrum.
What this reading confirms is that for all practical purposes, the U.S. economy has entered into what might be considered at the very least to be a "microrecession" in the first half of 2011, which confirms what the U.S. stock market first signaled would happen back in June 2010.
It is still too early to tell if the current economic sluggishness will last long enough or become severe enough for the National Bureau of Economic Research to react and classify the period as a full-blown recession.
You can say a lot of things about the GDP revision, but at least it wasn't unexpected (for anyone paying attention, that is!)
Labels: gdp, recession forecast
We may have been too optimistic last month in noting the end of a year-long period of microrecession in the U.S. economy.
Here, we've been tracking the number of public U.S. companies that have been announcing decreases in their dividends each month. August 2013 had seen the number of U.S. companies acting to cut their dividends drop below the key level of 10 per month, which we've previously observed marks the boundary between a growing U.S. economy and a U.S. economy that is experiencing recessionary conditions.
The data for September 2013 is now out, and the early suggestion is that the U.S. economy is not yet out of the woods.

As we ask in the chart, is this a proverbial dead cat bounce (a one-time event as the number of companies acting to cut their dividends bounces back into recessionary territory) or is the U.S. economy experiencing the same kind of recessionary conditions that characterized the entire year from July 2012 through July 2013?

There are two things of which we can be sure. Neither the impact of the partial U.S. government shutdown, which didn't even begin until 1 October 2013, nor the potential impact of a U.S. Treasury default on the U.S. national debt that President Obama has planned for 17 October 2013 are responsible for this outcome.
Instead, since the number of public U.S. companies announcing dividend cuts each month is perhaps the single best indicator of the real-time health of the private sector of the U.S. economy, what the data for September 2013 really suggests is that the U.S. economy is quite not as strong as the previous data indicated.
And that could be a more significant factor in driving today's stock prices than the increasing level of political noise emanating from Washington D.C.
Image Credit: InvestmentPaths.com.
According to the number of publicly-traded U.S. companies announcing cuts to their dividends, as of August 2013, the private sector of the U.S. economy has now fully exited the period of microrecession that it first entered in July 2012.

This new data confirms our call last month that the U.S. economy was exiting the recessionary conditions that had bogged it down since the third quarter of 2012.
Not uncoincidentally, this period of time also coincides with the Fed's latest quantitative easing programs. If not for the Fed's QE efforts, the U.S. economy would have experienced a full-fledged recession, rather than the more limited microrecession that it did.

Now that the U.S. economy is leaving those recessionary conditions behind, is it any wonder that the Federal Reserve is ready to begin trimming back the acquisitions of mortgage-backed securities and U.S. Treasuries that make up its current quantitative easing programs?
If you're looking for something fun to consider, try answering this question: If the Federal Reserve had not intervened to avoid the effects of a full-fledged recession in the U.S. economy in 2012, would President Obama ever have been re-elected?
References
Standard and Poor. Dividend Action Report. [Excel spreadsheet]. Accessed 10 September 2013.
Labels: dividends, economics, recession, recession forecast, stock market
In order to sustain dividend payments to their shareholders, companies generally need to have a couple of things going for them:
- They need to be profitable.
- They need to generate sufficient cash flow to make the dividend payments.
If either one of these things falls short on a sustained basis, the company may need to reduce their dividends. And that, of course, is almost universally bad for share prices, given the basic fundamentals for how stock prices work.
That in turn is bad for the company's primary owners and managers, who in addition to taking a financial hit on the shares of stock they might own in the company, also have to deal with a large number of very angry shareholders who weren't part of the decision, whose anger might force changes in the company's business practices and executive ranks.
So whenever a company acts to cuts its dividends, it's a pretty good indication that the company is experiencing some kind of real economic distress, because the outcome of that action is something that the company's primary owners and managers would seek to avoid if it were at all possible because of the pain associated with it for them. Yesterday, we showed that the number of U.S. companies acting to cut their dividends is once again consistent with recessionary conditions being present in the U.S. economy:
So is there a connection between companies cutting dividends and the employment situation in the United States?
We've taken the chart we normally use to track the change in the number of employed Americans by age since the total employment level in the U.S. peaked in November 2007, just before economic expansion peaked and the nation officially entered recession a month later, and have indicated with light red shaded lines the periods coinciding with an elevated number of companies cutting their dividends:

What we find is that whenever there are steadily more than 10 companies acting to cut their dividends in any given month, the trend in the number of employed Americans either falls, as when the economy is experiencing a full-fledged recession, or goes flat, as is the case at present, when an improving trend for employment stalls out.
What we observe with the employment situation at present is consistent with our previous observation that the U.S. economy is experiencing a microrecession.
Labels: dividends, jobs, SP 500
David Rosenberg is predicting a 99% chance of recession in 2012 (HT: Barry Ritholtz). Calling it a "second recession" as opposed to a double dip, we wondered if the stock market is currently making the same prediction.
After all, if we look just at the expected future earnings data for the stock market, 2012 would just be a year where the economy looks to be simply stagnant.
To see if a recession might need be in the cards, we'll need to look at the stock market's expected dividends per share. Our chart below reveals what we found when looking at quarterly dividends per share for the S&P 500 through the second quarter of 2012, which is currently as far into the future as we can see:

At the very least, the extreme reduction in cash dividends expected to be paid out in the second quarter of 2012 as compared to the first quarter suggests that the U.S. economy is at least in store for a "microrecession" in 2012. By our definition, a microrecession is a period of flat or negative economic growth that is either relatively minor or short in duration.
However, at this point in time, the dividend futures for the stock market are not signalling what is to come beyond that quarter, so we cannot yet determine if David Rosenberg will be right. We'll need to wait at least another quarter to see if a full-fledged recession is lying in wait in 2012.
Labels: dividends, recession forecast, SP 500, stock market
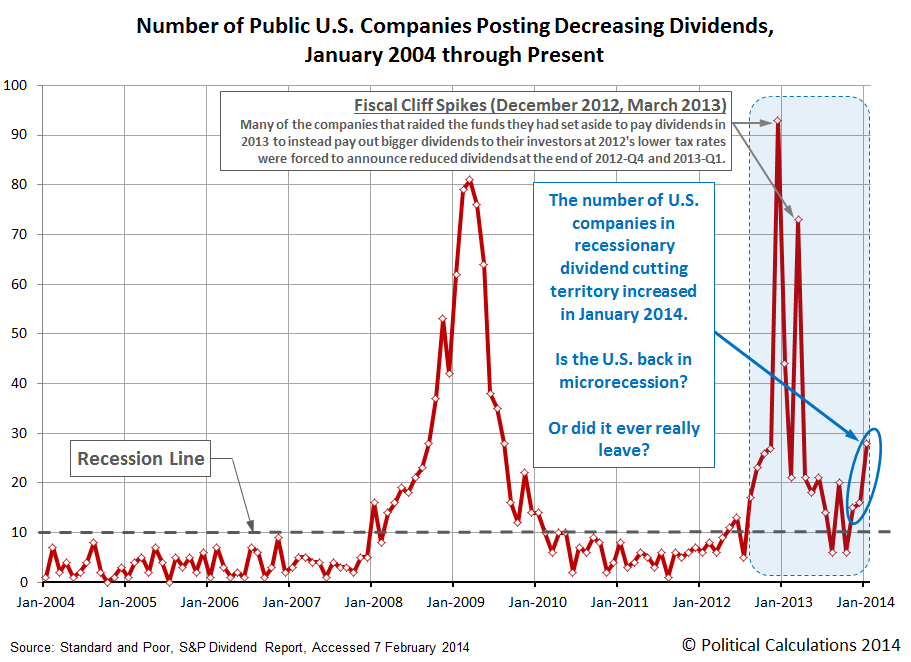
Picking up on the theme we introduced in our previous installment, we can't help but notice that the number of U.S. companies announcing that they are cutting their dividends increased to 28 in January 2014.
That's significant in that it only takes 10 companies to announce dividend cuts in a given month to indicate that recessionary conditions are present within the U.S. economy.
So it would seem then that the U.S. economy is back in what we would describe as a microrecession, which might be best thought of as when recessionary conditions are present, but are perhaps not of sufficient magnitude, scope or duration for the National Bureau of Economic Research to officially declare that the economy is in recession.
But really, if you look at what dividends have been communicating since mid-2012, it's not so much a question of whether the U.S. economy is once again experiencing the kind of economic conditions that are consistent being in a microrecession, but rather whether it ever really left.
That situation is something that has an effect on the nation's employment situation, which is something that we'll take on in our next post....
Data Source
Standard & Poor. Monthly Dividend Action Report. [Excel Spreadsheet]. Accessed 8 February 2014.
Want to see something pretty incredible? The chart below shows all the data we have for the number of public U.S. companies that have either increased or decreased their cash dividends since January 2004. Take a close look at the number of companies that Standard and Poor has initially recorded as having increased their dividends during the month of November 2014 and compare it with all the figures that have previously been reported.

Assuming this number will not dramatically revised downward, it would mean that 1,773 of the 2,979 declarations that U.S. companies made about their dividend payments in November 2014 involved increasing them. And yet, the amount of dividends that these companies are expected to pay in the future didn't increase all that much during November 2014!
That 1,773 figure would nearly five times larger than the previous record of 368 companies that declared they would increase their dividends back in January 2014.
That number was interesting enough that we dug deeper, tapping the Wayback Machine's archive of the data the Wall Street Journal's posts regarding the declarations that U.S. companies make on a daily basis. Although a week of data is missing from the beginning of the month, none of the data that was recorded suggests that anywhere near that many companies increased their dividends during the month, so we would anticipate that this figure will be corrected by S&P at some point in the future.
Update 2:30 PM EST: S&P's Howard Silverblatt moved fast to fix what turned out to be a typo - the actual number of U.S. companies increasing their dividends in November 2014 is 173! Our updated chart is below:

Meanwhile, we find that the number of companies that declared they would be decreasing their dividends increased slightly during the month.

At 17 companies, we find this figure is consistent with recessionary conditions being present in the U.S. economy, and more specifically, with what we describe as a microrecession. A microrecession represents the situation where recessionary conditions are present in the U.S. economy, but which are too limited in scope, severity or duration to be considered to be a full blown recession as defined by the National Bureau of Economic Research, the official arbiters of whether the U.S. economy is expanding or contracting.
Since we already went to the trouble of reviewing the archive of dividend declaration for the month of November 2014, we do have some insight into which companies are decreasing their dividends. We found that a number of oil industry-related firms cut their dividends during the month, which is perhaps the first confirmation we have that falling oil prices are negatively impacting that industry in the U.S. We counted nine such companies in the available archived data for the month.
If not for those particular dividend cuts, the number of companies cutting their dividends in November 2014 would have fallen below our identified recession line, indicating that much of the rest of the U.S. economy was comparatively healthy during the month, which might be expected since falling oil and fuel prices is a positive factor for other parts of the U.S. economy. Thus far then, the negative impact of these particular recessionary conditions for U.S. businesses is limited in its scope.
Data Source
Standard & Poor. Monthly Dividend Action Report. [Excel Spreadsheet]. Accessed 1 December 2014.
Labels: dividends, recession, stock market
According to Standard & Poor [Excel Spreadsheet], in March 2013, 73 publicly-traded companies in the U.S. acted to cut their dividends, the most since the all-time record of 93 was set in December 2012. To put those numbers in perspective, in a typical month when the U.S. economy is not being dragged down by recessionary conditions, fewer than 10 companies will act to cut their dividends.

But the U.S. economy is not currently in recession, despite having passed through what we'll describe as a microrecession in the fourth quarter of 2012, which is why the number of dividend cuts was so elevated in the second half of 2012 leading up to December. [By our definition, a microrecession is a period of very slow growth or even outright contraction in an economy that is too limited in scope, severity or duration to qualify as a full-fledged recession.] So something else would appear to be going on....
That something else appears to be going on is underscored by the number of dividend increases that have taken place since the end of 2012, as the first quarter of 2013 has seen an explosion in the number of companies announcing dividend increases, with 732 acting to do so at the same time so many companies were acting to cut theirs. By contrast, the first quarter of 2012 saw 552 companies acting to increase their dividends.

The reason why the number of dividend increases and decreases has gone absolutely haywire in the months from December 2012 through March 2013 has a lot to do with the unintended consequences of the fiscal cliff tax crisis in the United States at the end of December 2012.
Why So Many Dividend Cuts?
 Here, following the re-election of President Barack Obama, which ensured that higher tax rates would be imposed upon high income-earning Americans, influential investors began taking money out of the publicly-traded companies they own after 15 November 2012, following the President's meeting that day with a number of prominent U.S. corporate executives, in which President Obama failed to put a ceiling on his tax hike ambitions.
Fearing tax rates on dividends that might more than triple when the Bush-era tax rate of 15% for dividends expired at the end of 2012, the boards of some 711 U.S. companies acted to pay out extra or special dividend payments in November and December of 2012. The equivalent figure for 2011 is 214, which suggests that approximately 497 U.S. companies took this particular tax avoidance action on behalf of their shareholders.
In taking this action, many of these companies tapped the funds they were setting aside to pay regular dividend payments in 2013, primarily from the funds that would be used to pay dividends in the first quarter of that year. In doing so, many of these companies recognized that they would not have enough cash flow to fully regenerate all the funds that would be needed to pay out dividends in 2013 at the levels they had previously indicated they would.
Consequently, they also took the step of cutting their dividends. This explains why the number of dividend cuts spiked in the period from December 2012 through March 2013. Overall, some 231 companies acted to cut their dividends in this period, which compares to 27 companies cutting dividends in the same months of 2011.
With the first quarter now over, we expect that most of the fiscal cliff-driven dividend cuts have now taken place, which means the number of companies cutting their dividends each month will go back to being an indication of the relative health of the U.S. economy, much as it was prior to December 2012.
Why So Many Dividend Increases?
 Meanwhile, on 3 January 2013, a deal was reached in the U.S. Congress that put a ceiling of 23.8% on dividends, which represents a 20% tax on dividends plus an additional 3.8% tax that was imposed on dividends earned by high income earners as part of the Patient Protection and Affordable Care Act (a.k.a. "ObamaCare"). At the same time, the top ordinary income tax rate was set at 43.4%, which is the result of combinine the 39.6% top marginal rate and the new 3.8% ObamaCare tax on ordinary income for high income earners.
This difference in tax rates created a very large incentive for the major owners of publicly-traded companies in the U.S., who have the ability to pay themselves either in the form of a salary or in the form of dividends, to take a larger share of money they earned through their companies in the form of dividends rather than salary.
Side Note: Dividends are paid from the funds left over after companies have paid their corporate income taxes. Although the top corporate income tax rate is 35% in the U.S., one of the highest rates in the world, the average U.S. company actually pays around 12% of their net income in corporate income taxes. This is the real reason why the tax rates for both dividends and capital gains are set to be lower than ordinary tax rates, because once dividend and corporate income tax rates are combined, it effectively puts the tax rate on the money used to pay them back up into same level as the top tax rates that are applied against ordinary income.
Here's how that works. With a combined average corporate income and dividend tax rate of 35.8% on the money companies pay out as dividends, taking money in the form of dividends is less costly in taxes than income taken in the form of a salary for people whose ordinary income might place them in the 33%, 35% or the 39.6% tax brackets, which when combined with the new ObamaCare tax on individuals with high levels of ordinary income, can boost the marginal tax rates to as much as 36.8%, 38.8% and 43.4% respectively for these individuals.
The higher one's marginal tax bracket, the more desirable dividends become relative to salaries.
And that's why so many companies have acted to boost their dividends in the first quarter of 2013 following the fiscal cliff tax deal. It's not so much that the economy is improving (it is, but not by as much as dividend-driven stock prices would suggest), but rather, because they are the primary means by which the highly productive individuals behind these companies can keep more of the money they earn from the businesses they own and lead.
Risk of Even Higher Taxes Through Lost Deductions
There is one last element affecting the desire of people who have the ability to receive money from their businesses in the form of salary or dividends. President Obama and members of his party in the U.S. Congress are continuing to push to reduce the amount of tax deductions that high income earners can claim on their income tax returns in order to sustain the excessive level of spending the U.S. federal government has established during President Obama's tenure in office.
Because these tax deductions can only offset the portion of their income earned in the form of either wages or salaries, the continuing risk of having their taxes increased through these "hidden" tax hikes would only further incentivise high income earners to take even greater payments from their businesses in the form of dividends instead of salaries.
But then, that's another aspect of Hauser's Law at work today!
Labels: dividends, economics, stock market, taxes
If you were paying attention to the news yesterday, you probably heard that the United States' trade deficit with the rest of the world hit was the smallest it has been in several years. Which is being presented as a positive for the U.S. economy. Here is an excerpt of some key numbers from the news:
The U.S. trade deficit fell more than expected in March as imports of goods tumbled to their lowest level since 2010, a potential boost to first-quarter economic growth estimates that also hints at sluggish domestic demand.
[...]
In March, imports were held down by industrial supplies and materials imports which hit their lowest level since April 2004. Petroleum imports were the lowest since September 2002, even as oil prices rose to an average $27.68 per barrel.
Imports from China fell to their lowest level in three years. With exports rising, the politically sensitive U.S.-China trade deficit declined 25.7 percent to $20.9 billion in March.
But there is more to that story, and actually where the relative health of the U.S. economy is concerned, some, well, cause for concern. The following chart shows what we find when we calculate the year-over-year change in the growth rate of the exchange rate adjusted value of goods between the U.S. and China, which is important because it gives an indication of the relative health of the two largest economies in the world.
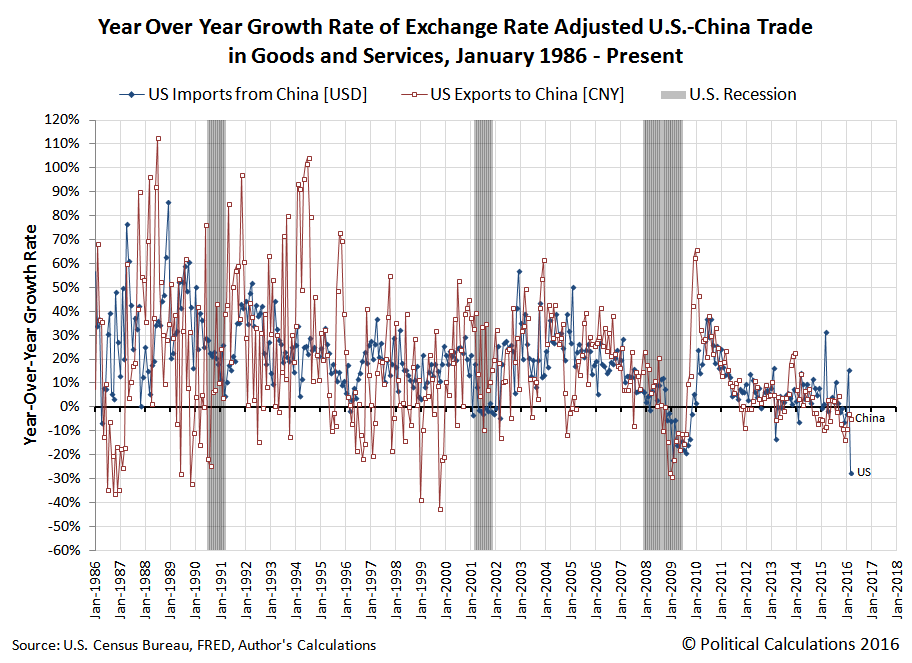
We see that for March 2016, the year over year growth rate for the goods that China imports from the U.S. and also the goods that the U.S. imports from China are in negative territory, which is an indication that things are not well with both economies.
While China's economy has been in this territory for some time, which coincides with that economy's struggles, what's more remarkable is the deep plunge that the U.S. economy would appear to have taken from the values recorded a year ago.
That's somewhat misleading, because a year ago, the amount of goods coming into the U.S. from China was elevated due to the end of a work slowdown by organized labor at the U.S.' west coast ports, which had created a significant backlog that took time to clear after it ended in February 2015. Last month, that work slowdown meant an elevated year over year growth rate, but in March 2016, that means a dramatic plunge in the year over year growth rate.
So how can we get a sense of the relative health of the U.S. economy from the most recently reported trade data when that dynamic is at work?
It occurred to us that we can take advantage of the cyclical nature of China's exports to the United States, which typically peak in either September or October of each year, and bottom in either February or March. We've shown that for the value of goods that the U.S. imports from China in the chart below for the period from January 2000 through March 2016, where we're showing the value of the goods in terms of both U.S. dollars (which is how Americans see the value of what it imports from China) and Chinese yuan (which is how the Chinese see the value of what it exports to the U.S.)
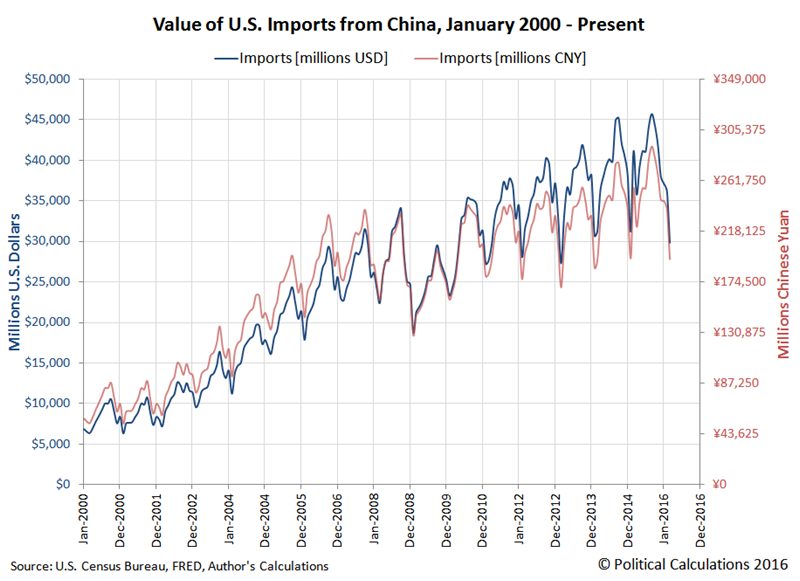
What if we calculated the percentage change from one year's bottom in the value of the goods that the U.S. imports from China to the next? Doing that should give us a pretty good idea of whether the value of trade is up, indicating positive economic growth since a growing economy will draw in more goods from elsewhere in the world to meet its growing demand, or if its down, indicating recessionary conditions are present in the U.S. economy. The following chart reveals what we found:
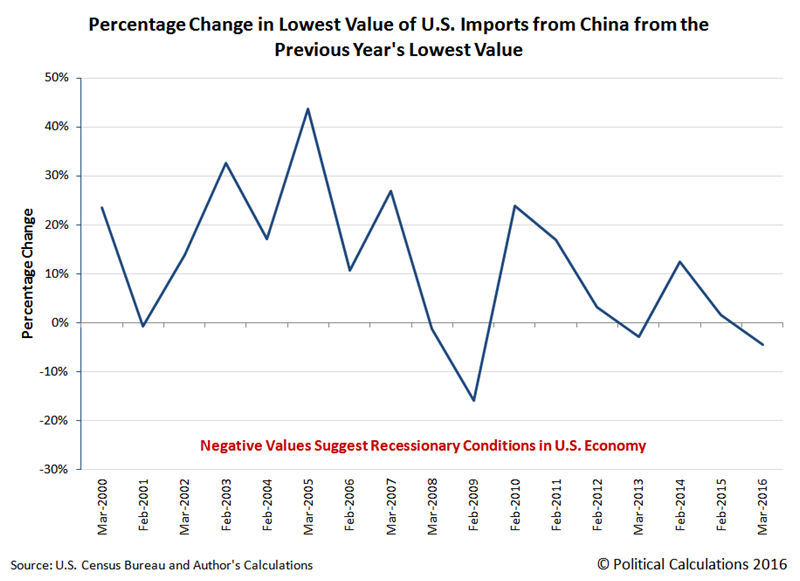
We see that negative values are consistent with recessionary conditions being present in the U.S. economy, coinciding with the 2001 recession, the 2008-2009 recession, and the 2012-2013 microrecession.
We also see that 2016 shows a negative value. Which is really remarkable because that's in comparison to the lowest month for U.S. imports from China in 2015, which was made lower in part because of the labor union orchestrated work slowdown at west coast ports that year.
Which then confirms that the relative health of the U.S. economy in March 2016 has deteriorated from what it was a year ago, and is also worse than what was observed during the 2012-2013 microrecession.
Data Sources
Board of Governors of the Federal Reserve System. China / U.S. Foreign Exchange Rate. G.5 Foreign Exchange Rates. Accessed 4 May 2016.
U.S. Census Bureau. Trade in Goods with China. Accessed 4 May 2016.
Labels: trade
Yesterday's announcement by the Federal Reserve that it will not begin reducing its purchases of U.S. Treasuries and mortgage-backed securities with newly created money (a.k.a. "Quantitative Easing" or simply, QE) was a surprise.
Or was it really?
You would have to count us among those who were surprised that the Fed decided to hold off on trimming its $85 billion per month on average security-buying spree. We fully expected that the Fed was going to announce that it would reduce its pace of acquisitions by somewhere between $10 and $20 billion per month, which we base on our assessment that the U.S. economy has finally begun to recover from a year-long microrecession.
But was it really a surprise to all investors across the board?
The reason we ask that question is because the unique measure of probability that we developed specifically to determine how likely that investors collectively believe that the Fed might announce that it would reduce its QE purchases this month, rather than in 2014, has been sending a very different signal for weeks:

As we can see in the chart, our estimated probability that the Fed would taper sooner peaked at 78% (with a typical margin of error of +/- 15%) on 31 August 2013. Since then however, that probability has itself tapered off, and going into 18 September 2013, the day of the Fed's announcement, it had been cut nearly in half to 42%.
We had interpreted that decrease as being consistent with investors shifting their forward-looking focus for setting their expectations for stock prices to the more distant future. We reasoned that since there was so little time left in 2013-Q3, there was little point for investors to continue speculating on the future of the Fed's QE program, since the clock was ticking down on both when the Fed would make its announcement and the effective end of the quarter (the dividend futures contracts for 2013-Q3 expire this upcoming Friday, 20 September 2013).

We reckoned that investors were shifting their attention to the first quarter of 2014 in setting their expectations for making their investment decisions. And paradoxically, that's exactly the same outcome we would expect for a future where the Fed would choose to delay trimming back on its QE program.
So what if a number of influential investors had instead come to the conclusion that the Fed would sustain its current pace of security acquisitions for its QE program? Anticipating the upward market move that would accompany such a policy adjustment, could they have been buying up stocks at comparatively low prices in advance of the announcement, driving up stock prices in such a way that they were really communicating that the Fed would keep the status quo with its QE program?
We don't know if we'll ever find out the answer to that one, except perhaps by how much profit-taking now takes place over the next few weeks now that the Fed's announcement is behind us. It's just a good thing that one way or another, the market was shifting to focus on the future as defined by 2014-Q1, which has meant, and will continue to mean, generally rising stock prices in the absence of a significant level of new noise in the market.
Speaking of which, the leading contender for a new negative noise event at this time would be a partial federal government shutdown sometime in October 2013. That potential perhaps explains why the Fed opted to continue its program, since it has already proven itself to be capable of offsetting bad and ineffective fiscal policies emanating from Washington D.C.
And if the Fed really wanted to send a message to the people in Washington D.C. who really need to receive it, it would act to boost its QE efforts by 60% of the amount that federal government spending would be reduced in the event of such a partial government shutdown, since this additional amount of QE would be sufficient to completely offset the negative fiscal drag on the nation's GDP that would result from such a partial shutdown.
After all, there's really no good reason to put the rest of the American people through any more economic hardship because of poor fiscal policies emanating from Washington D.C. At long last, perhaps its time for the politicians and bureaucrats to pay the price for their bad behavior, and the best way to target them is to let them go through the kabuki theater of a government shutdown, but to offset it with enough QE so that regular Americans would be hardly affected by their actions.
Is there anything worse for a politician or a bureaucrat than finding out that they don't have the power they think they do? In this case, would there be any better public service that the Fed could perform for the American people?
The strongest force affecting future GDP is inertia.
At least, it is if you go by our "modified limo" approach to forecasting future GDP!
Here, we took a forecasting approach originally developed by Steve Conover, which he called the "climbing limo" method, and adapted it to produce a more accurate projection of GDP in the near term (the next quarter) than what the climbing limo method delivers (although to be fair, the climbing limo method was developed to look three quarters into the future - there's a lot that can happen in the meantime to sway the economy off the course that method would forecast!)
Now that the GDP data for the second quarter of 2011 has been finalized, we can now project where real GDP will be in 2011-Q3, using the tool we developed to forecast the next quarter's GDP!
The graph below visualizes the forecast presented by our tool:

In reality, the target value of $13,299.8 billion in constant 2005 U.S. dollars that we've projected for the inflation-adjusted value of GDP in the third quarter of 2011 represents the midpoint of the forecast range into which we expect GDP to be in 2011-Q3.
Assuming that the deviation between our modified limo forecast value and actual GDP can be described by a normal distribution, we estimate a 68.2% probability of the BEA recording real GDP for 2011-Q3 somewhere between $13,160.1 billion and $13,439.5 billion, and a 95% probability of it falling between $13,020.4 billion and $13,579.2 billion. There is a 99.7% probability of 2011-Q3's GDP figure being recorded somewhere between $12,880.8 billion and $13,718.8 billion.
The midpoint value of our forecast range for the third quarter of 2011 would represent a 0.8% annualized rate of growth for the U.S. economy. We would describe that level of growth as near-recessionary, if not recessionary. Or as we might better describe it, given the data we have today, the odds are that U.S. will continue to experience what might best be described as a microrecession. But then, such is the nature of inertia.
We'll finally note that there is a 50% chance the U.S. economy is currently performing better than this forecast figure would anticipate and a 50% chance it's currently performing worse. We'll find out which is the case on 27 October 2011.
Labels: gdp forecast, tool
President Obama has been claiming while out on the campaign trail that he has created over five million jobs since being sworn into office in January 2009.
Today, we're going to adapt the chart we normally feature after each monthly employment situation report to see what the real numbers are, by age group!
Our chart below reveals what we found:

Overall, we find that there are 743,000 fewer employed teens through October 2012 as compared to January 2009, while young adults between the ages of 20 and 24 saw their numbers increase by just 497,000. Adults Age 25 or older saw their numbers among the employed ranks of the U.S. workforce increase by a relatively lackluster 1,443,000.
Altogether, that brings President Obama's total jobs created for his presidency up to 1,197,000, about 76% below his claimed job creation figure of 5,000,000. Put another way, President Obama's net job creation ability is less than one-fourth as good as he claims it to be. And where teen employment is concerned, outright negative.
All of the positive net gain in jobs for President Obama have come within the last three months after having been stalled out in the first half of 2012. This outcome is consistent with our observation that the U.S. economy went through a microrecession in the second quarter of 2012, followed by a much more robust performance in the third quarter.
We continue to anticipate that growth in the U.S. economy will decelerate off its third quarter pace, which will likely be more negatively affected by the disruptive effects of Hurricane Sandy in the northeastern United States than we had originally forecast.
Labels: jobs
In December 2014, the number of publicly-traded U.S. companies announcing that they would reduce their dividend payments jumped up to 25, a level that we believe is consistent with contractionary distress being present within the U.S. economy.

From our observations of the limited data available, having 10 or more companies announce that they are cutting their dividend payments in a single month is sufficient to indicate that there are recessionary conditions in the U.S. economy. When that figure rises above 20 per month, it tends to coincide with some degree of contraction within the U.S. economy, which can impair the nation's GDP.
That's not to say that level of contraction qualifies as a full-bore recession - from all indications, it's more a sign that there is an increased degree of distress within the U.S. economy that is, as yet, too limited in scale, scope or duration to qualify as an official period of recession as might be determined by the National Bureau of Economic Research, which we describe being in a state of microrecession.
While the number of U.S. companies acting to cut their cash dividend payments to investors has been above the recession line for some time, the type of company announcing dividend cuts has begun to expand in recent months. Prior to November 2014, most firms announcing dividend cuts were those that are especially sensitive to rising interest rates, such as real estate investment trusts, which have been on tap ever since the U.S. Federal Reserve confirmed that it would be terminating its most recent quantitative easing programs by the end of 2014.
While many of those types of firms are still announcing dividend cuts, we've observed an increasing number of oil industry-related firms that have begun taking similar actions in response to falling profits, which are being driven by plunging world oil prices and their effect upon business revenues.
At present, it would appear that the fallout is very limited in scope, with just a handful of very small and price-sensitive firms in oil-related industries taking the action of cutting their dividends as their revenue and profit prospects fade. The big questions going into 2015 are: how far will oil prices drop, how long might they stay depressed and will other sectors be able to benefit enough to offset the distress in the oil industry? The answers to these questions will determine the duration and severity of the recessionary forces at work within this sector of the U.S. economy and the stock market as a whole.
Data Source
Standard & Poor. Monthly Dividend Report. [Excel Spreadsheet]. Accessed 6 January 2015.
Welcome to the blogosphere's toolchest! Here, unlike other blogs dedicated to analyzing current events, we create easy-to-use, simple tools to do the math related to them so you can get in on the action too! If you would like to learn more about these tools, or if you would like to contribute ideas to develop for this blog, please e-mail us at:
ironman at politicalcalculations
Thanks in advance!
Closing values for previous trading day.
This site is primarily powered by:

CSS Validation

RSS Site Feed

JavaScript
The tools on this site are built using JavaScript. If you would like to learn more, one of the best free resources on the web is available at W3Schools.com.
Other Cool Resources
Blog Roll


