Last April, we were asked to contribute a question to Tim Kane's quarterly survey of economics bloggers for 2012-Q2. After reflecting on the potential causes for the very statistically unlikely number of upward revisions to the number of new jobless claims filed each week over the past year, we submitted the following question:
The Wall Street Journal has reported that the advance number of seasonally-adjusted initial unemployment insurance claims filed each week has been revised upward in 56 of the past 57 weeks. If this were a coin toss, the probability of that occurring would be 2,528,336,632,909,751 to 1, which makes the event extremely statistically unlikely. What is the primary reason behind why the BLS' collection and reporting of the initial data would appear to be so deeply flawed?
- Seasonal adjustments that no longer reflect reality well enough to account for the difference between initial and later revised counts.
- Inadequate counting practices by the 50+ state agencies that report this data weekly to the BLS.
- Deliberate delays in reporting the full scale of the worst case increases in the number of claims recorded each week to create a rosier impression of the data.
Here are the survey results:
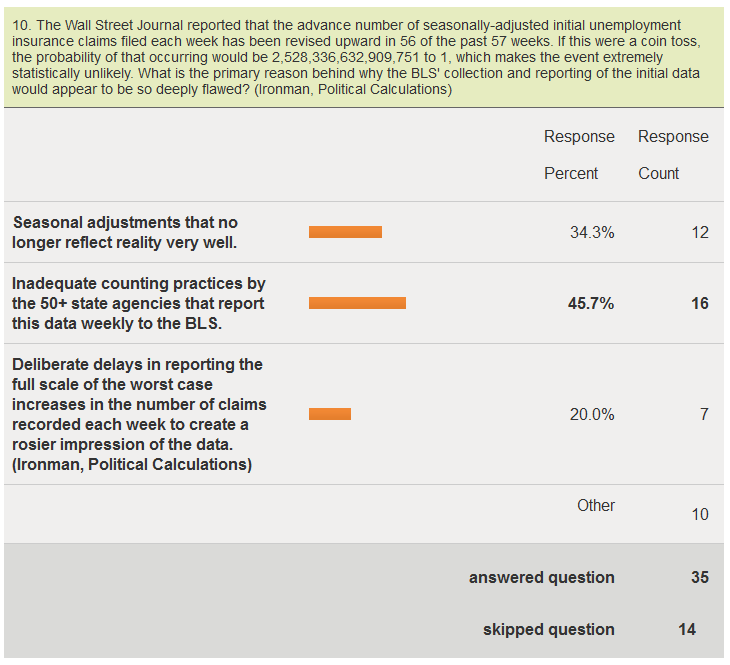
We selected the second explanation in the live voting for the survey, but we were surprised that it didn't win an outright majority. Today however, thanks to a large anomaly in reporting the number of new jobless claims last week, we have an answer to the question that would seem to confirm "Inadequate counting practices by the 50+ state agencies that report this data weekly to the BLS" as the correct answer to the question. James Pethokoukis reports on Strategas' Don Rissmiller's analysis of the reporting anomaly:
One of the driving reasons for the less-than-expected growth was one state, which was expected to report a large increase but instead reported a decline. Unfortunately we will have to wait until next week's release to find out which state it was; the state breakdown is always one week delayed.
And also JPMorgan's Daniel Silver's view, in which he identifies which state had the problem:
We won't know for sure which state caused the large drop in claims during the week ending October 6 until the state-level data become available next week. It was likely a state with a large population and we suspect that it was California based on the occasional massive swings that have occurred in its claims data in the past.
Fox Business' Dunstan Prial and Peter Barnes report on what the BLS has to say about the derelect data counting and reporting practices of the state in question:
Because one state left out a chunk of its weekly reports from last week, the jobless claims numbers will likely be revised upward in the coming week.
The spokesman said the lack of reporting affected the season adjustment for the week, likely by about 30,000 fewer claims.
In addition, the spokesman explained to FOX Business that this large state has a history of reporting "volatile" numbers at the beginning of quarters and that the Labor Department has complained and tried to work with the state to more accurately report its claims but with little success.
"There is no explanation" for the volatility. "We have tried and tried to work with them. It's like playing hardball with them," the spokesman said.
The spokesman said that the unprocessed claims are likely to show up in the numbers in the next week or two. "We should see some sort of catch up."
That apparently was too much truth for one day, as another BLS spokesman tried to walk back the observation, we suspect after getting some rather loud and angry calls from one particular state's employment security department:
Later Thursday, another Labor Department spokesman issued a statement in effort to clarify what the agency described as “confusion” over the data. The latter statement seemed to refute the department's earlier explanation.
"The decline in claims this week was driven by smaller than expected increases in most states and because of drops in claims in a number of states where we were expecting an increase," the statement said. "No single state was responsible for the majority of the decline in initial unemployment insurance claims."
We'll let Pierpont Securities' Stephen Stanley get the final word, as reported by Marketwatch:
Added Stephen Stanley of Pierpont Securities: "The formula for the size of a claimant's benefit check is derived based on an average of their last few quarters of pay (the more you were earning before being laid off, the bigger your unemployment check would be). Thus, in many cases, it pays for a laid-off worker to game the formula by waiting until the beginning of the next calendar quarter to file (if they can wait that long), as they may have been getting paid more in the quarter when they were laid off than in the quarter that rolls out of the equation if they wait."
"As a result, there is an accumulation of claims that are likely submitted over a period of several weeks but not processed until the turn of the quarter. Apparently, the state in question (and it pretty much has to be California to account for anything close to 30,000) forgot to include that stockpile of unprocessed claims in their tally for this week (which is the first week of a new calendar quarter). Since the seasonal factors expected an unadjusted surge of almost 20% in the period to account for the quarterly filing pattern, failure to adhere to that pattern in the raw data (unadjusted claims were only up 8.6%) creates a big drop seasonally adjusted."
So we see that inadequate counting practices by the 50+ state agencies that report this data weekly to the BLS, and for the week ending 6 October 2012, one large state in particular, is responsible for the ongoing issues with the continual undercounting of the initial number of seasonally adjusted initial unemployment insurance claims filed each week.
Welcome to the blogosphere's toolchest! Here, unlike other blogs dedicated to analyzing current events, we create easy-to-use, simple tools to do the math related to them so you can get in on the action too! If you would like to learn more about these tools, or if you would like to contribute ideas to develop for this blog, please e-mail us at:
ironman at politicalcalculations
Thanks in advance!
Closing values for previous trading day.
This site is primarily powered by:
CSS Validation

RSS Site Feed
JavaScript
The tools on this site are built using JavaScript. If you would like to learn more, one of the best free resources on the web is available at W3Schools.com.
Other Cool Resources
Blog Roll


