to your HTML Add class="sortable" to any table you'd like to make sortable Click on the headers to sort Thanks to many, many people for contributions and suggestions. Licenced as X11: http://www.kryogenix.org/code/browser/licence.html This basically means: do what you want with it. */ var stIsIE = /*@cc_on!@*/false; sorttable = { init: function() { // quit if this function has already been called if (arguments.callee.done) return; // flag this function so we don't do the same thing twice arguments.callee.done = true; // kill the timer if (_timer) clearInterval(_timer); if (!document.createElement || !document.getElementsByTagName) return; sorttable.DATE_RE = /^(\d\d?)[\/\.-](\d\d?)[\/\.-]((\d\d)?\d\d)$/; forEach(document.getElementsByTagName('table'), function(table) { if (table.className.search(/\bsortable\b/) != -1) { sorttable.makeSortable(table); } }); }, makeSortable: function(table) { if (table.getElementsByTagName('thead').length == 0) { // table doesn't have a tHead. Since it should have, create one and // put the first table row in it. the = document.createElement('thead'); the.appendChild(table.rows[0]); table.insertBefore(the,table.firstChild); } // Safari doesn't support table.tHead, sigh if (table.tHead == null) table.tHead = table.getElementsByTagName('thead')[0]; if (table.tHead.rows.length != 1) return; // can't cope with two header rows // Sorttable v1 put rows with a class of "sortbottom" at the bottom (as // "total" rows, for example). This is B&R, since what you're supposed // to do is put them in a tfoot. So, if there are sortbottom rows, // for backwards compatibility, move them to tfoot (creating it if needed). sortbottomrows = []; for (var i=0; i
In a article, we indicated that the U.S. Census' data on the value of U.S.-China international trade was overstating the growth in the value of that trade because of the falling value of the U.S. dollar with respect to China's currency, the renminbi (or as its often referred to in foreign exchange, the yuan):
Here, we see that the growth of China's exports to the United States is continuing its trend of slow growth, while following its typical seasonal pattern. Typically, China's exports to the U.S. peak each year in the period from August to October, in advance of the U.S.' holiday shopping season.
In reality, because the value of the U.S. dollar has been falling with respect to the value of China's currency since early 2010, the value of trade shown in the chart above represents a lower quantity of actual goods and services traded today than what similar values in 2010 would indicate.
Today we're going to show that's exactly the case. In our first chart, we're showing the value of goods and services imported by the United States from China priced in both U.S. dollars, as reported by the U.S. Census, and priced in Chinese yuan, going by the official exchange rate recorded by the U.S. Federal Reserve.
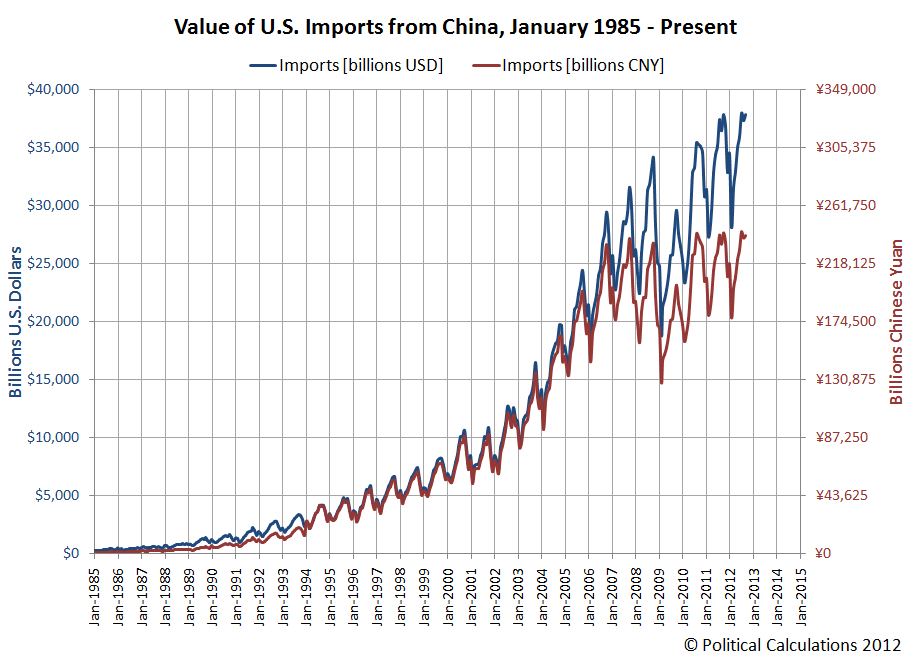
In the chart, we've tweaked the vertical scale for the Chinese yuan so that it corresponds to that currency's minimum value with respect to the U.S. dollar from January 1994, when the value of the yuan was set to be worth just 11.46 cents (or 0.1146 U.S. dollars). As of October 2012, the relative value of the dollar has fallen so that one yuan is now worth 15.96 cents (or 0.1596 U.S. dollars).
With that visual adjustment made, we discover that from the Chinese perspective, there has been almost no increase in the value of China's exports to the United States since 2010, and very little growth since 2007.
Our second chart shows how U.S. exports to China have fared in terms of both U.S. dollars and Chinese yuan:
Measured in terms of China's currency, we find that the value of U.S. exports to China has actually been declining since they peaked in January 2010, which coincides with the peak of that nation's economic stimulus spending, which it had earlier specified on 6 March 2009. (The announcement of how the Chinese government would implement its massive stimulus program is the economic event that finally arrested and reversed the steep decline of the U.S. stock market at the time following the U.S. fiscal crisis of 2008.)
Our final chart shows the year-over-year growth rates for the U.S. imports from China calculated in terms of the U.S. dollar-based data and for U.S. exports to China calculated in terms of Chinese yuan-based figures, since these units are how each nation's economy would actually see the value of trade imported from the other nation:
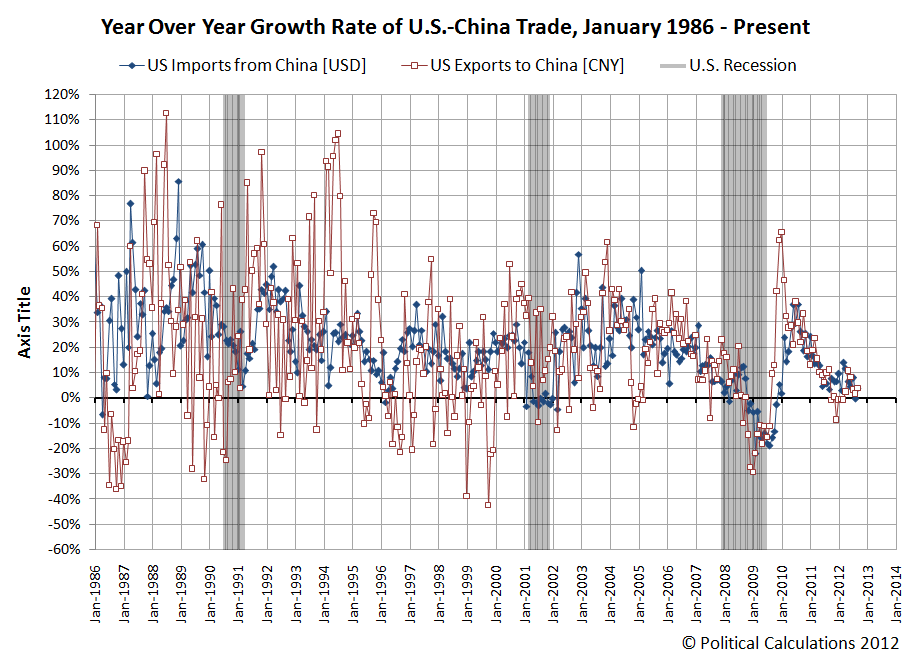
Through September 2012, we find the year-over-year growth rate of trade between the two nations is at near-zero levels of growth, indicating near recessionary conditions if we take this measure as an indication of the relative health of the economies of both nations. But perhaps the real news is what factoring in the falling dollar does for our impression of the health of China's economy.
Previously, using just the U.S. dollar-based growth rate of U.S. exports to China, we found that China's economy had entered into recession in December 2011.
But after factoring in the falling value of the dollar over time, which results in the growth rate of trade between the two nations being overstated on the Chinese side of the trade balance, we find that China's economy really slipped into recession some two months earlier, in October 2011. This month coincides with the beginning of a period of contraction for China's manufacturing industries.
Going forward, we'll be using this improved version of our trade growth rate chart in our analysis of the relative economic health of both the United States and China.
Labels: trade
Welcome to the blogosphere's toolchest! Here, unlike other blogs dedicated to analyzing current events, we create easy-to-use, simple tools to do the math related to them so you can get in on the action too! If you would like to learn more about these tools, or if you would like to contribute ideas to develop for this blog, please e-mail us at:
The S&P 500 at Your Fingertips
The Distribution of Income for 2010: Individuals
Should You Trade in Your Gas Guzzler?
What Are the Chances Your Marriage Will Last?
Tipping Around the World
What's Your Body Fat Percentage?
The Odds of Dying, Again!
Gas Prices, the Unemployment Rate, and Desperation
Hauser's Law
The Real Story Behind "Rising" U.S. Income Inequality
First Time Visitor to Political Calculations?
On the Moneyed Midways
A Lot, But Not All, of Our Tools
Political Calculations' U.S. GDP Temperature Gauge provides a means to quickly evaluate the growth rate of the U.S. economy against the backdrop of how the economy has performed since 1980, with the "temperature" color spectrum ranging from a recessionary "cold" (purple) through an expansionary "hot" (red).
The GDP Temperature Gauge presents both the annualized GDP growth rate as reported by the U.S. Bureau of Economic Analysis reports for a one-quarter period and also as averaged over a two quarter period, which smooths out the volatility seen in the one-quarter data and provides a better indication of the relative strength of the U.S. economy over time.
This site is primarily powered by:
Visitors since December 6, 2004:
The tools on this site are built using JavaScript. If you would like to learn more, one of the best free resources on the web is available at W3Schools.com.
ZunZun - Exceptional regression analysis tool.
Wolfram Integrator - Solve integrals. Do calculus!
Create a Graph - Easy-to-use basic graph-making tool.
Many Eyes - Data visualization extraordinaire!
Wolfram Alpha - Computational knowledge engine.
Khan Academy - Math & science video mini-lectures!
Picasion - Animate images.
Bloodhoundblog
Budgets Are Sexy
Cafe Hayek
Carpe Diem
Core77
Coyote Blog
Craig Harper
Darwin's Finance
Digerati Life, The
Division of Labour
Dough Roller, The
Eclectecon
Econlog
Economics Roundtable
EconomicsUK
Environmental Economics
Escape from Cubicle Nation
Execupundit
FiscalGeek
Get Rich Slowly
Gongol
Good Financial Cents
HR Bartender
Hot Air
i4cp Productivity
Innocent Bystanders
Innovation and Growth
Instapundit
Intangible Economy
I've Paid Twice for This Already
Joanne Jacobs
Kaus Files
Len Penzo dot Com
Making Ripples
Market Power
Mechonomics
Mighty Bargain Hunter
Monevator
My Dollar Plan
New Economist
Newmark's Door
Nina Simosko
Physorg
Private Sector Development
Real Clear Politics
Richard Fernandez
Roger L. Simon
Rowan Manahan
Sound Politics
SOX First
Sports Economist, The
squawkfox
Three Star Leadership
Tim Worstall
Townhall
Trusted Advisor
Uncommon Misperceptions
voluntaryXchange
WILLisms
Winterspeak
Big Picture, The
Crackerjack Finance
CXO Advisory Group
Disciplined Approach to Investing
Dividend Guy, The
Doug Short
Evidence Investing
Fat Pitch Financials
FX Investment Strategies
Oilprice
American Red Cross
Children's Heart Foundation
Salvation Army
SMA Foundation
Kindle Paperwhite 3G - Best e-reader!
Angel in the Whirlwind
Bailout Nation
Cartoon Guide to Statistics
A Comprehensive Guide to the Peloponnesian War
The Complete Personal Memoirs of Ulysses S. Grant
The Count of Monte Cristo
Ender's Game
Gardner's Art Through the Ages
Empire of Wealth
How to Make Presentations to Councils and Boards
Juran's Quality Handbook
Marks' Standard Handbook
The Second World War
Stocks for the Long Run
Why Smart Executives Fail
The Tudors: The Complete Series
Kindle Fire HD 8.9" 4G LTE Wireless 32 GB
Snap Circuits Jr. SC-100
Nerf Vortex Praxis
Sony BRAVIA 40" LED HDTV
2540 Series Docking Station
New Balance MX623
Dunham Men's Waterproof Oxford
TN360 Black Toner Cartridge
The Dangerous Book for Boys
Air Swimmer Remote Control Inflatable Flying Shark
Fisher-Price Little People Lil Pirate Ship