October 2012 marked a significant event for the S&P 500 - the first time since 1999 that there were more than 400 dividend paying companies in the index!
But what affects the number of companies that pay dividends?
To answer that question, we turned to Standard and Poor's Dividends and Payers report [Excel spreadsheet], which provides the data for the number of dividend paying companies in the S&P for each year since 1980. We've taken that data, combined it with some significant milestones and presented it in the chart below (which is updated from our 2009 post on the topic.)
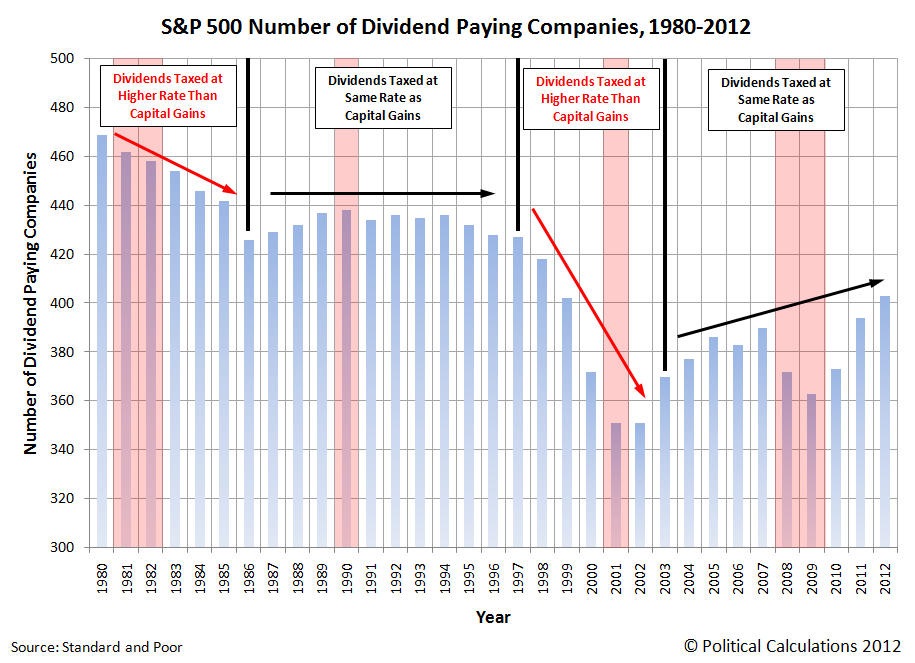
We find that while recessions tend to lower the number of companies paying dividends while they're ongoing, which we would expect, we find that the bigger driver of what affects the number of companies paying dividends to individual shareholders, retirement and pension plans, et cetera would appear to be the relative tax rate of dividends with respect to capital gains.
For example, in 1978, before we have data showing the percentage of S&P 500 dividend payers, the capital gains tax rate was reduced from a maximum tax rate of 39.9% (that's on paper - the real maximum capital gains tax rate was 49.9% as a result of an interaction with the maximum regular income tax rate) to 28%, which was then lowered to 20% in 1981.
By contrast, the tax rate for dividends was the same as for personal income taxes, with a maximum tax rate of 50% beginning in 1982. Prior to 1982, the maximum personal income tax rate was 70%.
That changed with the U.S. Tax Reform Act of 1986, which equalized the maximum tax rates for both dividends and capital gains at 28%.
In the period before 1986, the number of S&P 500 companies that paid dividends to their shareholders declined from 469 in 1980 (or 93.8% of all companies making up the index) to 426 companies in 1986 (or 85.2%). After 1986, the number of dividend paying companies in the S&P 500 was largely stable, ranging between 426 and 438 for the next decade.
That stability ended with the Taxpayer Relief Act of 1997. Here, the capital gains tax rate was reduced from 28% to 20%, while the tax rate of dividends was held at the 28% level. As we can see in the chart above, this change in tax law coincided with a dramatic drop in the number of companies within the S&P 500 that paid dividends, which plummeted from 427 in 1997 to 351 in both 2001 and 2002.
That decline wasn't reversed until 2003, with the passage of the Jobs and Growth Tax Relief Reconciliation Act, which once again equalized the tax rates of both capital gains and dividends, but this time at 15%.
Since then, the number of dividend paying companies in the S&P 500 has rising from 351 in 2002 to 403 in 2012, despite a recession-driven dip to 363 companies in 2009.
But all that is about to end. On 1 January 2013, the tax rate for dividends will rise above that for capital gains - it's only a question of how much.
Thanks to a special tax on dividends and investment income imposed by the Patient Protection and Affordable Care Act of 2010 (aka "ObamaCare"), the tax rate on dividends will at least rise from 15% to 18.6%, while the capital gains tax rate will remain the same. We say "at least" because we don't yet know the resolution for the so-called "fiscal cliff", in which all the tax cuts implemented in the 2003 Jobs and Growth Tax Relief Reconciliation Act are scheduled to expire. If that comes to pass as currently mandated by law, the maximum tax rate upon dividends will rise to 43.8%.
In the best case scenario, without Congress acting to equalize these tax rates, given on what we see in the correlation of the tax rates for both dividends and capital gains, it's very likely that companies paying dividends will begin becoming more scarce in 2013.
In the worst case scenario, the imbalance between dividend and capital gains taxes will lead to significant distortions in the stock market and economy, similar to those that were created by the Taxpayer Relief Act of 1997, which caused the "Dot-Com" stock market bubble, whose inflation and deflation cycles were only ended with the passage of the 2003 tax cuts equalizing those tax rates.
As a policy recommendation, the only outcome that can avoid that kind of economic distortion is for the tax rates for dividends and for capital gains tax rate to be set equal to one another. We don't have much hope for that happening given how much Silicon Valley money backed President Obama in the election. Since they were the primary beneficiaries of the last imbalance between dividend and capital gains tax rates, they may be hoping for a repeat of their economic boom days.
If you think about it, Silicon Valley's digital aristocracy would seem to have a lot in common with a South Pacific cargo cult on this count....
Data Reference
Standard and Poor. S&P 500 Dividends and Payers. [Excel Spreadsheet]. Accessed 11 November 2012.
Labels: dividends, SP 500, taxes
Welcome to the blogosphere's toolchest! Here, unlike other blogs dedicated to analyzing current events, we create easy-to-use, simple tools to do the math related to them so you can get in on the action too! If you would like to learn more about these tools, or if you would like to contribute ideas to develop for this blog, please e-mail us at:
ironman at politicalcalculations
Thanks in advance!
Closing values for previous trading day.
This site is primarily powered by:
CSS Validation

RSS Site Feed
JavaScript
The tools on this site are built using JavaScript. If you would like to learn more, one of the best free resources on the web is available at W3Schools.com.
Other Cool Resources
Blog Roll


