We've long known that the U.S. stock market's "Dot Com Bubble" really began in April 1997 and ended in June 2003, but we've never addressed two key questions about the event:
- What caused it to begin?
- What caused it to end?
Today, we can answer those two questions. Let's begin by revisiting and tweaking our operational definition of just what an economic bubble is:
An economic bubble exists whenever the price of an asset that may be freely exchanged in a well-established market first soars then plummets over a sustained period of time at rates that are decoupled from the rate of growth of the income that might reasonably be expected to be realized from owning or holding the asset.
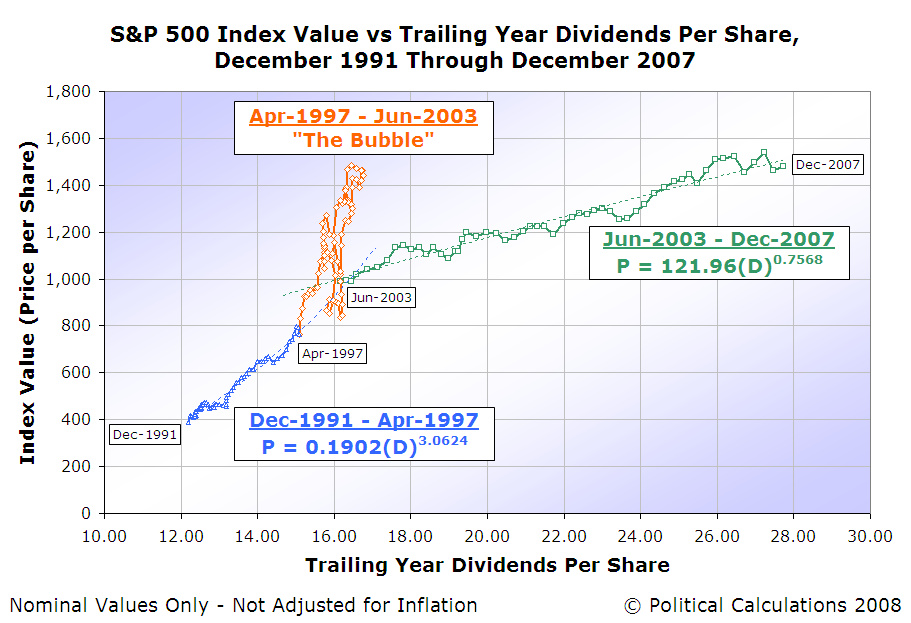
By applying that definition and noting the last month that changes in stock prices were coupled with changes in their underlying dividends per share before the Dot Com Bubble began, we identified April 1997 as the true starting point in time for the Dot Com Bubble. Likewise, we identified June 2003 as being the first month following the end of the period in which changes in stock prices and their dividends per share were decoupled from one another.
Having now identified those key months, we can look toward the specific events that occurred either during that month or the month preceding these months to identify the specific causes of the Dot Com Bubble's beginning and end.
As it happens, we discovered the specific cause behind the rapid expansion of the Dot Com Bubble in what we'll describe as a landmark paper by Zhonglan Dai, Douglas A. Shackelford and Harold H. Zhang. In "Capital Gains Taxes and Stock Return Volatility: Evidence from the Taxpayer Relief Act of 1997", Dai, Shackelford and Zhang describe the events that led to the Dot Com Bubble's inflation:
We use the Taxpayer Relief Act of 1997 as our event to empirically test the impact of a change in the capital gains tax rate on stock return volatility. TRA97 lowered the maximum tax rate on capital gains for individual investors from 28 percent to 20 percent for assets held more than 18 months. TRA97 is particularly attractive for an event study because the capital gains tax cut was large and relatively unexpected, and the bill included few other changes that might confound our analysis. Little information was released about TRA97, until Wednesday, April 30, 1997, when the Congressional Budget Office (CBO) surprisingly announced that the estimate of the 1997 deficit had been reduced by $45 billion. Two days later, on May 2, the President and Congressional leaders announced an agreement to balance the budget by 2002 and, among other things, reduce the capital gains tax rate. These announcements greatly increased the probability of a capital gains tax cut. On Wednesday, May 7, 1997, Senate Finance Chairman William Roth and House Ways and Means Chairman William Archer jointly announced that the effective date on any reduction in the capital gains tax rate would be May 7, 1997. As promised, the lower tax rate on long-term capital gains (eventually set at 20 percent) became retroactively effective to May 7, 1997, when the President signed the legislation on August 5, 1997.
Empirically testing stock market return data before and after the key date of 7 May 1997, when investors would suddenly have a reasonable expectation that a reduction in the capital gains tax rate would become effective, the authors made a stunning finding:
To provide more compelling evidence that the 1997 tax cut affected volatility (and mitigate concerns about omitted correlated variables), we focus on cross-sectional tests which are designed to detect the differential responses in return volatility of stocks with different characteristics. We hypothesize that the effect of a capital gains tax change on stock return volatility should vary depending upon dividend policy and the size of the unrealized capital losses (or gains). Consistent with expectations, we find that non- and lower dividend-paying stocks experienced a larger increase in return volatility than high dividend-paying stocks. We also find that stocks with large unrealized capital losses had a larger increase in return volatility after a capital gains tax rate reduction than stocks with small unrealized capital losses. However, we do not find a similar relation with unrealized capital gains.
The difference in volatility between high dividend-paying stocks and non-or-low dividend paying stocks provided the key evidence pointing the finger at the Taxpayer Relief Act of 1997:
We infer from the findings in this study that the volatility left, after controlling for every known determinant, reflects the influence of the 1997 capital gains tax rate cut. Stock return volatility was substantially greater after 1997. Furthermore, firms most affected by the rate reduction showed the greatest change in volatility. Specifically, non-dividend paying firms had a greater increase in volatility than dividend-paying firms and firms with large unrealized capital losses experienced a greater increase in volatility than firms with small unrealized losses.
The reason we find that conclusion to be significant is because the Taxpayer Relief Act of 1997 left dividend tax rates unchanged - they continued to be taxed at the same rates as regular income in the United States, which provided a powerful incentive for investors to treat the two kinds of stocks very differently, favoring the low-to-no dividend paying stocks over those that paid out more significant dividends.
At least, until May 2003, when the compromises that led to, and ultimately the signing of the Jobs and Growth Tax Relief Reconciliation Act of 2003 would set both the tax rates for capital gains and for dividends to once again be equal to one another, as they had been in the years from 1986 through 1997:

With the disparity in taxes assessed against dividend paying compared to non-dividend paying stocks now gone, stock prices once again resumed their closely-coupled relationship with their dividends per share, and volatility was reduced.
Of course, that raises the question of why a bubble didn't exist in the pre-1986 period where both capital gains and dividends were taxed at different rates. We would however point out that a very large percentage of publicly-traded companies paid dividends in that earlier period, limiting the effect of such a disparity.
By contrast, the founding and rapid growth of new computer and Internet technology-oriented companies in the early 1990s, which grew rapidly to become large companies and which as growth companies, did not pay significant dividends to shareholders, provided the critical mass needed for the 1997 capital gains tax cut to launch the Dot Com Bubble. We can see this in the size of Initial Public Offerings in each year since 1980, beginning from a very low level at the beginning of the 1980s, to their peak at the height of the Dot Com Bubble:

In the end however, we find that it took an act of Congress to launch the stock market bubble of the late 1990s, and that it took another act of Congress to undo its disruptive effect. The Taxpayer Relief Act of 1997 and the Jobs and Growth Tax Relief Reconciliation Act of 2003 are quite literally the bookends defining the period of disorder in the U.S. stock market known as the Dot Com Bubble.
Labels: dividends, SP 500, stock market, taxes
Welcome to the blogosphere's toolchest! Here, unlike other blogs dedicated to analyzing current events, we create easy-to-use, simple tools to do the math related to them so you can get in on the action too! If you would like to learn more about these tools, or if you would like to contribute ideas to develop for this blog, please e-mail us at:
ironman at politicalcalculations
Thanks in advance!
Closing values for previous trading day.
This site is primarily powered by:
CSS Validation

RSS Site Feed
JavaScript
The tools on this site are built using JavaScript. If you would like to learn more, one of the best free resources on the web is available at W3Schools.com.
Other Cool Resources
Blog Roll


