When should you sell your stocks?
We asked that specific question several weeks ago, before we exploited the fractal nature of stock prices in developing an objective statistics-based method for determining when to tell if an upward microtrend for stocks was about to break.
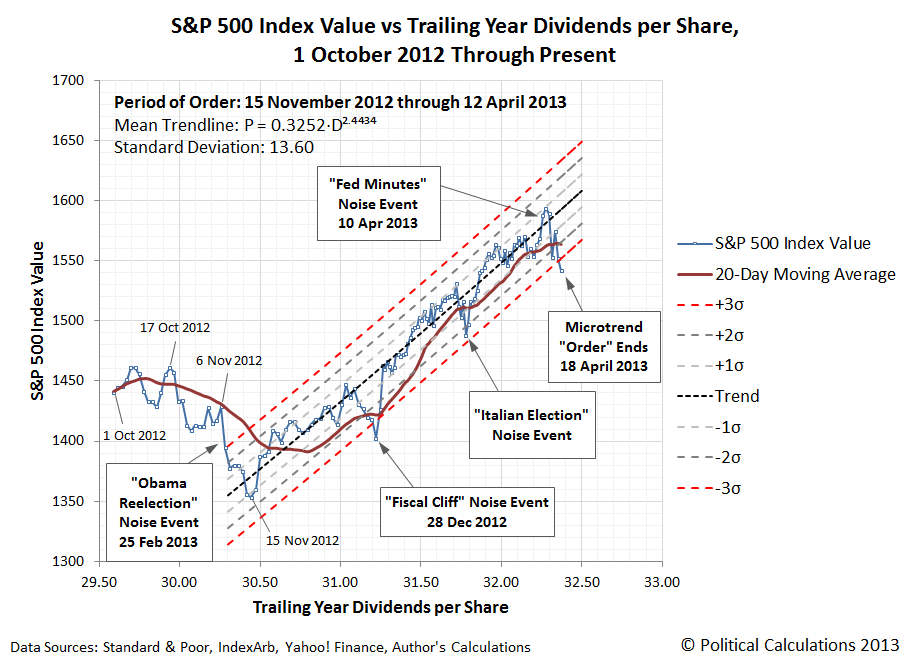
We then tracked stock prices closely using that method, as it didn't take long before the recent upward microtrend we were tracking would appear to have broken, as stock prices suddenly dropped below the statistically-expected, or "normal", target range:

But then, one day earlier, we said that maybe that isn't such a good signal to follow in deciding to pull the trigger for selling stocks, explaining the technical reasons why, and then suggesting a more "conservative approach" for deciding when to actually sell:
We should also recognize that since we're using both a power law-based regression analysis and a statistics-based approach to define these curves, there is a possibility that data points falling outside the red-dashed curves could be outliers for the established trend, rather than an indication that a state of order in the market has broken down. A more conservative approach for making a decision to sell in these circumstances would be to wait for the 20-day moving average of stock prices to fall outside the "normal" range for stock prices with respect to their trailing year dividends per share, which would be a confirmation that a previous state of relative order in the market has ended.
And then, four days after we said that, we explained why the rally for the S&P 500 wasn't really over.
Tired of all this jumping about back and forth in time? Good! Let's catch up to the present and update that earlier chart, keeping everything the same except for the daily stock prices and their 20-day moving average, which is now updated through 13 May 2013. Pay close attention especially to the moving average....

As you can see, the 20-day moving average never moved outside the statistically-expected "normal" target range. And thus, this more conservative approach for deciding when to sell stocks, or in this case, for deciding to not sell stocks, was the right approach to follow. At least through yesterday.
We'd be happy to tell you what's going to happen next, but we don't like to repeat ourselves and we're not sure if we haven't already. Sometimes, there's just no telling if we're even telling you these things in anything close to the right order!
Labels: chaos, quality, SP 500
Welcome to the blogosphere's toolchest! Here, unlike other blogs dedicated to analyzing current events, we create easy-to-use, simple tools to do the math related to them so you can get in on the action too! If you would like to learn more about these tools, or if you would like to contribute ideas to develop for this blog, please e-mail us at:
ironman at politicalcalculations
Thanks in advance!
Closing values for previous trading day.
This site is primarily powered by:
CSS Validation
RSS Site Feed
JavaScript
The tools on this site are built using JavaScript. If you would like to learn more, one of the best free resources on the web is available at W3Schools.com.