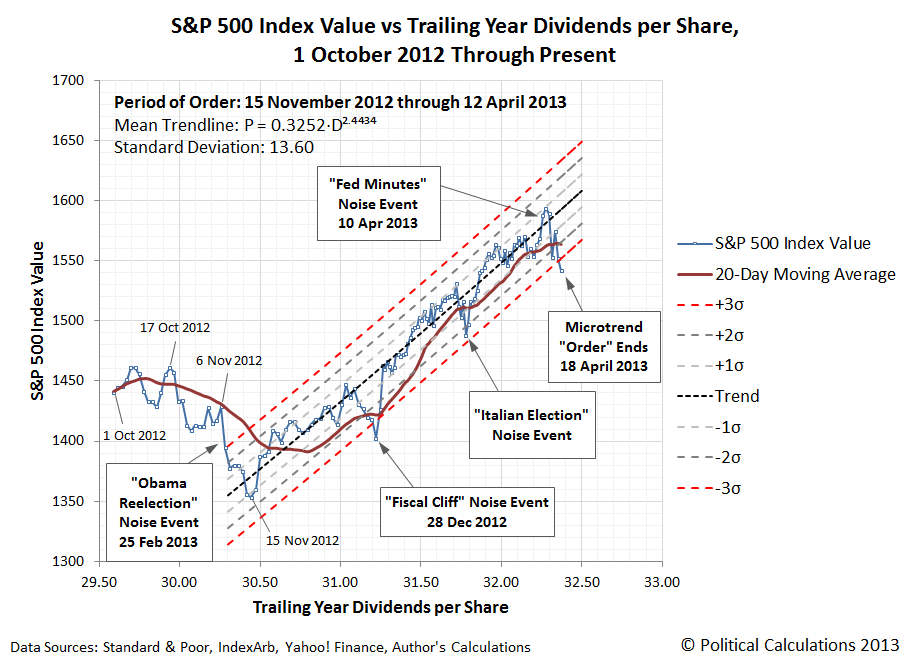
We love it when we can both identify and quantify a noise event in the U.S. stock market! The accidental early release of the Federal Reserve's Open Market Committee's 19-20 March 2013 meeting minutes on 10 April 2013 gives us some unique data on how the Fed can affect asset prices with its policy statements.
Here's how CNN's Annalyn Kurtz described the content of the FOMC's meeting minutes:
The minutes contained very little new information about Fed policy. The main takeaway is most Fed members think the central bank should continue buying $85 billion in assets a month, at least through midyear.
But some members argued in favor of tapering down the purchases gradually while others didn't see a need to decrease the purchases until the third quarter. Two said some purchases would probably continue into 2014.
Being a journalist, Kurtz likely wouldn't appreciate how this news might affect markets. In committing to continue its current $85 billion worth of asset purchases ($40 billion in mortgage backed securities, $45 billion in U.S. Treasuries) per month through the middle of the year, and with a general consensus that the purchases would continue through the end of 2013, whether at the current level or at a decreasing level, the FOMC eliminated a lot of uncertainty for investors.
In effect, the Fed's policy commits it to sustain long term interest rates at low levels through 2013, which is beneficial for companies that might borrow money to fund their business expansion, and particularly those that use debt to finance their growth. Investors would then gain from that expanded business activity.
Knowing that now, let's look at what the market knew before the Fed acted to remedy its accidental release at 9:00 AM EDT on 10 April 2013, some 30 minutes before the market opened:
Unlike European markets which are sharply increasing today, the S&P 500 should open in a slight rise of 0.2%. It had closed up 0.35% at 1568 points, being very close to absolute records during the day.
At economic level, traders are waiting for Crude Oil Inventories at 10.30 am EST, the Federal Budget Balance and FOMC Meeting Minutes at 2 pm EST which should confirm the continuation of asset purchases by the Fed.
That story was reported at 8:48 AM EDT. A 0.2% increase to open the market would correspond to a value of 1571, just 3 points higher than it closed on 9 April 2013. The following chart shows what happened instead, after investors had over 30 minutes to digest the information contained in the FOMC's meeting minutes, almost an eternity in market time where unexpected information typically affects stock prices within two to four minutes of becoming known, after the market opened for trading at 9:30 AM EDT:

Quite a difference! But then, all noise events eventually end - it's only ever a question of when.

As best as we can tell, the response to the Fed Minutes noise event kept the rally that began after 15 November 2012 alive for a few days longer than it might have otherwise, while also marking the top for the rally.
And that will be the last time we'll feature that particular chart. What the end of order means here is simply that the most recent microtrend for the S&P 500 is over. We'll have more thoughts on that soon!
Labels: SP 500, stock market
Welcome to the blogosphere's toolchest! Here, unlike other blogs dedicated to analyzing current events, we create easy-to-use, simple tools to do the math related to them so you can get in on the action too! If you would like to learn more about these tools, or if you would like to contribute ideas to develop for this blog, please e-mail us at:
ironman at politicalcalculations
Thanks in advance!
Closing values for previous trading day.
This site is primarily powered by:
CSS Validation
RSS Site Feed
JavaScript
The tools on this site are built using JavaScript. If you would like to learn more, one of the best free resources on the web is available at W3Schools.com.