Last Friday, we declared that order had indeed broken down for the S&P 500, marking the end of the most recent rally for the U.S. stock market.
But is the rally really over? Well, we can't say that just quite yet, as it happens. To understand why we would appear to be contradicting ourselves, let's take a step back and consider just how we've arrived at this point!
It all started when we decided to address a specific challenge back on 5 April 2013. We had indicated a week earlier that a 150-point plunge in the value of the S&P 500 would be a "clear sell signal", but we wondered if we could come up with an objective approach that might minimize the downside risk of holding onto stocks too long after they've begun to turn south, while also not missing out on any potential gains that would occur if a stockholder sold their shares too soon.
So we got fractal with the S&P 500, focusing in tightly on the most recent microtrend for the market.
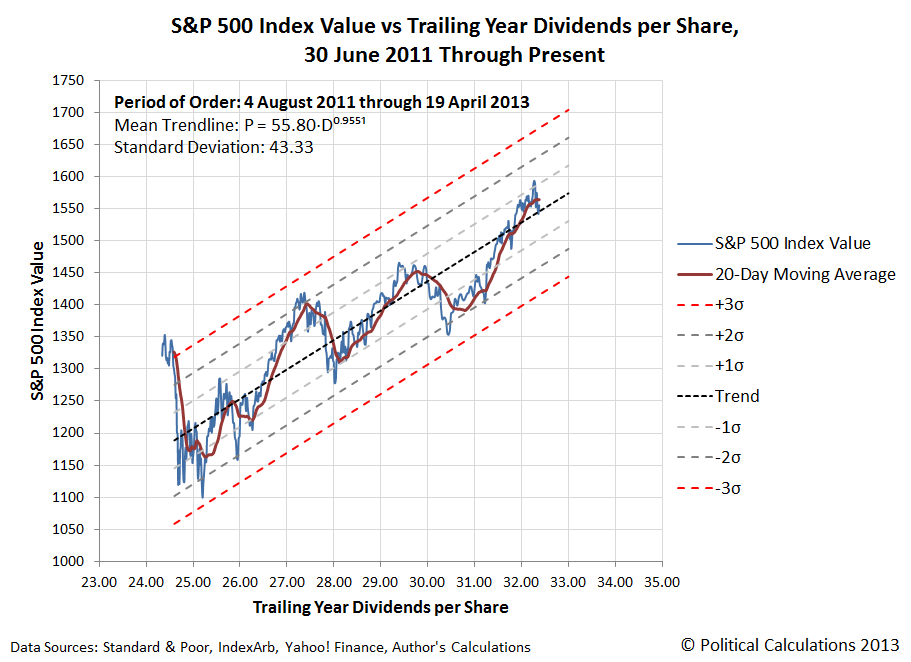
It's that microtrend rally in the S&P 500 that that appeared to be on the verge of ending last Thursday morning, and that is now very likely over. Meanwhile, there's a longer term rally for which the microtrend that just ended is only a short-term run - let's take a step backward to see it!:

As of the close of trading on 19 April 2013, the value of the S&P 500 index was $1,555.25 per share, which is about 10 points above the mean trend curve shown on the chart, and 140 points above the level that would correspond to a breakdown in this longer term period of relative order in the stock market for the indicated value of trailing year dividends per share.
See this reference for how we define things like order, disorder, disruptive events and bubbles for the stock market.
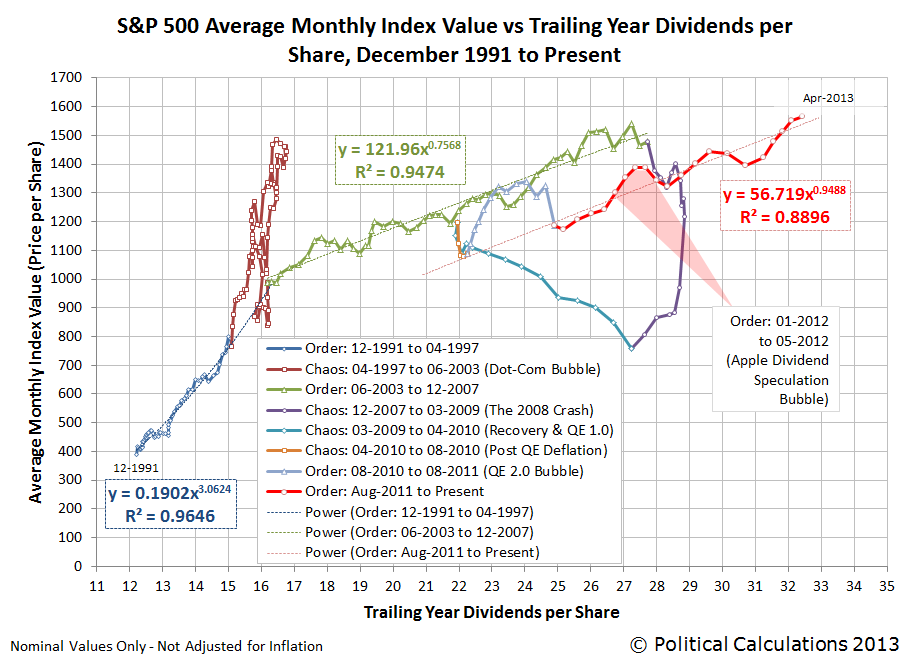
And to take an even larger step backward, the following chart shows just the mean trend lines for the long-term periods of order that have existed in the stock market over the past 22 years:

So this is what people like Barry Ritholtz mean when they say that the market bull run is not over (yet). Even if they mess up things like what was really responsible for generating the most recent rally. (Quantitative easing, Barry? Really? That thing the Fed started doing nearly a month after the rally for stock prices actually began?)
Ah, but we bust Barry's chops over a very small thing - he's still one of the better market observers out there!
Welcome to the blogosphere's toolchest! Here, unlike other blogs dedicated to analyzing current events, we create easy-to-use, simple tools to do the math related to them so you can get in on the action too! If you would like to learn more about these tools, or if you would like to contribute ideas to develop for this blog, please e-mail us at:
ironman at politicalcalculations
Thanks in advance!
Closing values for previous trading day.
This site is primarily powered by:
CSS Validation
RSS Site Feed
JavaScript
The tools on this site are built using JavaScript. If you would like to learn more, one of the best free resources on the web is available at W3Schools.com.