Remember our chart from last Friday, 21 June 2013 - the one that we said wouldn't be sending a "sell signal" until sometime in the next week?
Well, here you go, as we update our chart through Wednesday, 26 June 2013. Now what will you do?
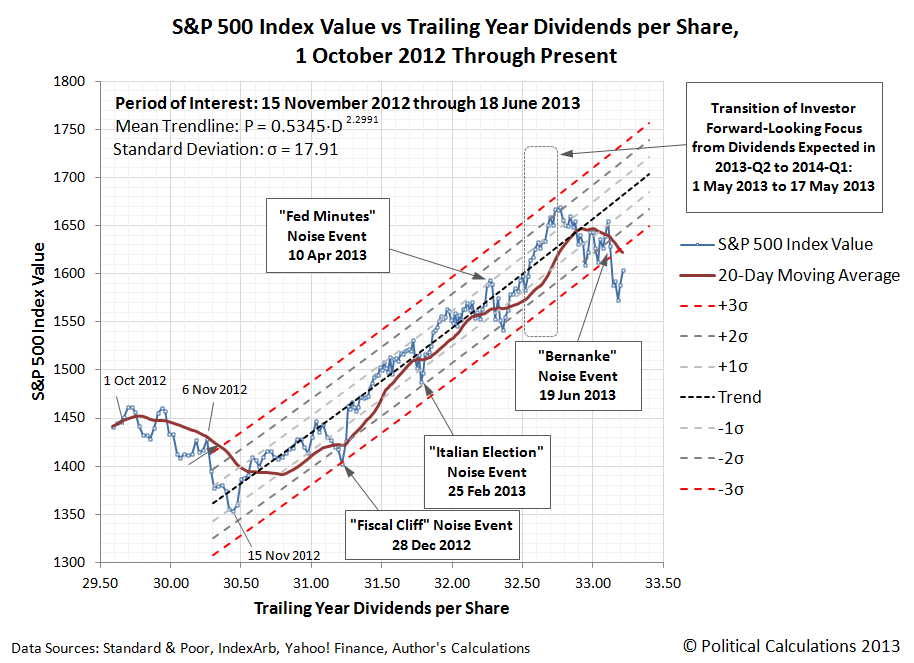
If it helps, what this chart is really saying is that the period of relative order in the market that accompanied the rally that really got underway after 15 November 2012 is over. With the 20-day moving average for stock prices having now moved outside the outer limits of our "normal" target range for this period of order, we can say that the data points falling outside this range aren't just outliers for an existing trend, but are rather evidence that the previous trend itself has broken down.
And yet, the question remains. Now what will you do?
If it helps, let's zoom out and look at the larger scale trend for stock prices. The one that has existed since stock prices stabilized onto an overall upward trajectory following the aftermath of the end of QE 2.0 (our first chart focused on just the region of this chart within the purple rectangle):

Well, that didn't help much, did it? Well, how about this. Our favorite indicator of distress in the stock market, the price-dividend growth ratio (the "G-ratio") appears to have peaked this month. Typically, when that happens, stock prices will go on to hit a significant trough within the next three months, falling from the average level of stock prices for the month in which the peak in the G-ratio occurred.
Now what will you do?
Welcome to the blogosphere's toolchest! Here, unlike other blogs dedicated to analyzing current events, we create easy-to-use, simple tools to do the math related to them so you can get in on the action too! If you would like to learn more about these tools, or if you would like to contribute ideas to develop for this blog, please e-mail us at:
ironman at politicalcalculations
Thanks in advance!
Closing values for previous trading day.
This site is primarily powered by:
CSS Validation

RSS Site Feed
JavaScript
The tools on this site are built using JavaScript. If you would like to learn more, one of the best free resources on the web is available at W3Schools.com.
Other Cool Resources
Blog Roll


