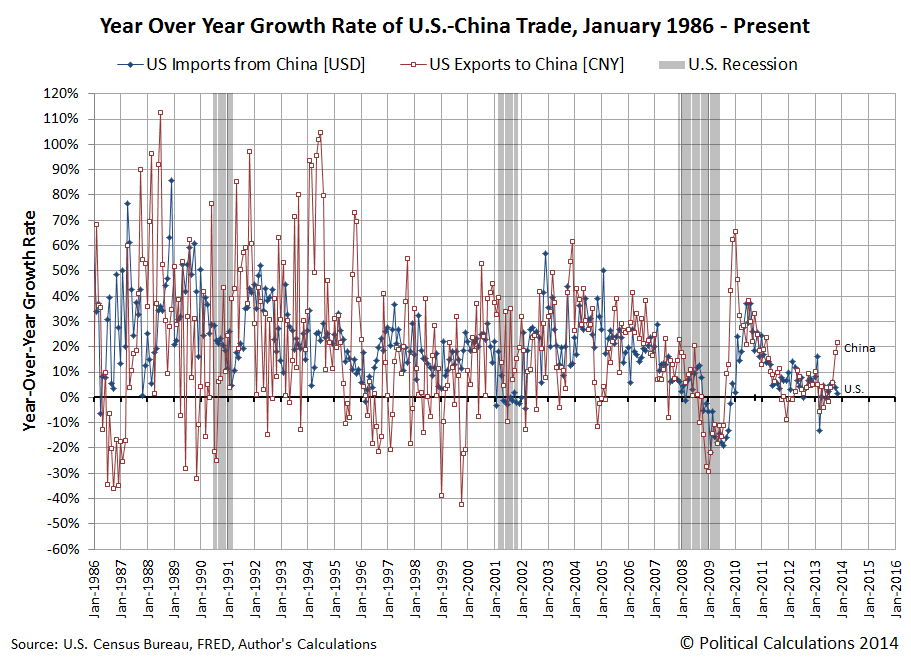
Last week, news that China's economy is slowing down contributed to investor fears in world stock markets, sending equity prices lower. Not trusting Chinese GDP statistics, which have long been considered to be off target, we turned to the data that the U.S. Census Bureau reports on the value of trade between the U.S. and China to get a clearer picture of what's going on within China's economy.
Our chart below shows the exchange rate adjusted value of the year-over-year growth rate of trade between the two nations from January 1986 through November 2013, the most recent month for which that data is available at this writing:
At first glance, it would appear that China's economy is actually accelerating strongly, with China pulling in a dramatic increase of goods produced in the United States.
That first glance may be somewhat deceiving however, because the U.S. goods that China is pulling in such dramatically higher quantities are predominantly soybeans, where U.S. farmers recently harvested a record bumper crop. The unexpectedly large harvest boosted U.S. GDP in the third quarter of 2013 through its impact on U.S. inventories, and may continue to boost U.S. GDP again in the fourth quarter of 2013 in the form of increased exports.
And it would appear, predominantly to China, which is the top foreign market for U.S. soybeans. Through 5 December 2013, China had increased its year-over-year purchases of U.S. soy by 33%. The U.S. is second behind Brazil as an exporter of soybeans to China, and China is the world's largest importer of soybeans.
Digging deeper into the trade data however, we found that the value of U.S. exports to China in November 2013 could have been even larger if not for a $396 billion decline in transportation equipment, primarily aircraft, exported by the U.S. to China during the month. In 2013, U.S.-based Boeing delivered over one-fifth of its annual production of 648 commercial aircraft to China-based air carriers, so November represented somewhat of an off month for this trade category.
What that indicates then is that China's economic consumption is growing more rapidly than its official GDP statistics would suggest, as it would appear that the Chinese government's efforts to promote more domestic consumption are producing the desired results. China's reported GDP is lower because the nation's domestic investment spending has declined while Chinese consumption of imported goods has increased. Both factors would be negative contributors to China's reported GDP, which are being offset by increased consumption spending.
That increase in China's imports may be due in part to the Chinese government's 26 July 2013 edict to 1,400 domestic producers in 19 of the nation's industries to curb their "excess" production capacity by the end of September 2013. If Chinese demand for the affected products did not similarly decline, that would account a good portion of the nation's increase in its imports since mid-summer 2013.
For our analytical method for measuring the relative health of the U.S. and Chinese economies, the upshot of all this is that our method will likely overstate the strength of China's economic growth until the rebalancing of the Chinese economy has stabilized.
References
Board of Governors of the Federal Reserve System. China / U.S. Foreign Exchange Rate. G.5 Foreign Exchange Rates. Accessed 26 January 2014.
U.S. Census Bureau. Trade in Goods with China. Accessed 26 January 2014.
Labels: trade
Welcome to the blogosphere's toolchest! Here, unlike other blogs dedicated to analyzing current events, we create easy-to-use, simple tools to do the math related to them so you can get in on the action too! If you would like to learn more about these tools, or if you would like to contribute ideas to develop for this blog, please e-mail us at:
ironman at politicalcalculations
Thanks in advance!
Closing values for previous trading day.
This site is primarily powered by:
CSS Validation
RSS Site Feed
JavaScript
The tools on this site are built using JavaScript. If you would like to learn more, one of the best free resources on the web is available at W3Schools.com.
