From time to time, we encounter some really strange comments from people who are generally well respected in the world of stock market analysis.
Meet Dennis Gartman, since 1987, the author of the Gartman Letter, and frequent commentator on CNBC. Here's what he said about the current state of the stock market just last week, on Wednesday, 21 May 2014:
The stock market is in the midst of a correction, closely followed investor Dennis Gartman told CNBC on Wednesday.
"I think the process began several weeks ago … [with] the Nasdaq," the publisher of The Gartman Letter said in a "Squawk Box" interview. "We're in a correction right now."
A correction is defined as a 10 percent decline in major averages from their highs. As of Tuesday's close, the Dow Jones Industrial Average was down 2 percent, the S&P 500 was down 1.5 percent, while the Nasdaq was off 6 percent from their 52-week highs.
It doesn't sound like much of a correction, does it? And if you paid attention to where stock prices went on to finish the week, as the S&P 500 closed at a new record high, it's pretty difficult to square Gartman's declaration with apparent reality.
But, what if there was a correction - a major one - that nobody noticed because it was invisible?
Here's how that might work. Last week, we recognized that stock prices had begun deviating from where our dividend-based model had indicated they would be in the previous week, as the stock market was experiencing what we described as a "noise event". We went on to say that we expected that stock prices would "once again converge with the future as defined by the dividends expected for 2014-Q3, which would be positive for stock prices in the short term", unless it were followed by an additional noise event.
Alas, that's exactly what happened on 20 May 2014! Fortunately, that was a very short-lived noise event, as stock prices went on to "converge with the future as defined by the dividends expected for 2014-Q3" on Friday, 23 May 2014.
Words can only do so much to describe that activity, so here's our alternative futures chart, updated with the actual recorded stock prices through Friday, 23 May 2014, to help visualize what happened:
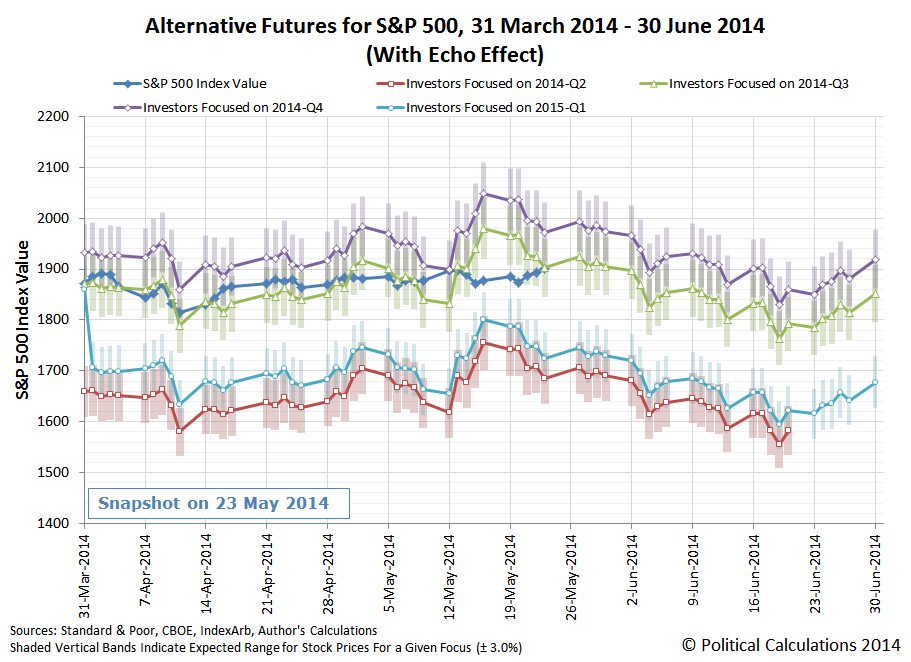
So if you look at the period between 14 May 2014 and 23 May 2014, you see a pretty big deviation between what stock prices actually were and what our model projected. In fact, there's about a 108 point difference between the midpoint of the likely range of stock prices associated with a focus on 2014-Q3 and what the S&P 500 actually did. That gap represents the equivalent of a 5.4% correction.
And if for some reason investors had shifted their forward-looking focus to 2014-Q4 during that time, that gap opens up to be 177 points wide - an 8.6% virtual correction!
That means that what we have here is an invisible correction - where stock prices were set to rise substantially, but didn't, because a significant correction wiped out all of the rise, leaving behind the impression that stock prices were mostly drifting sideways instead.
Yeah, we don't buy that one either, but it's fun to think about! As for Dennis Gartman, let's revisit his call back in February 2014 that the stock market was set to experience a 15% correction, and see how that worked out:
A prediction that stocks would see a 15 percent correction was off, Dennis Gartman said Monday.
"Vociferously, I'd say I was wrong," he said. "We got to a trend line that really did hold. I didn't think it would hold. It did, in fact, hold."
Hmmm. "A trend line that really did hold". We think we may know what's giving Gartman those false signals....
Welcome to the blogosphere's toolchest! Here, unlike other blogs dedicated to analyzing current events, we create easy-to-use, simple tools to do the math related to them so you can get in on the action too! If you would like to learn more about these tools, or if you would like to contribute ideas to develop for this blog, please e-mail us at:
ironman at politicalcalculations
Thanks in advance!
Closing values for previous trading day.
This site is primarily powered by:
CSS Validation

RSS Site Feed
JavaScript
The tools on this site are built using JavaScript. If you would like to learn more, one of the best free resources on the web is available at W3Schools.com.
Other Cool Resources
Blog Roll


