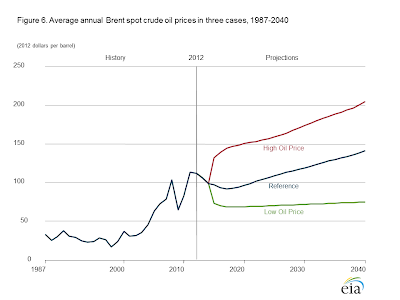
How much of a change in global oil prices can be attributed to changes in the relative demand for oil? And how much might be attributed to changes in the relative supply of oil?
Those are questions that we've asked and answered before, but now, for the first time, we can finally quantify the extent to which either of these economic factors may be driving the price!
We can do that math now thanks to the work of James Hamilton, who built a model of how much world oil prices change in response to changes in the prices of other commodities - ones that are particularly sensitive to changes in the demand for them: copper, U.S. dollars, and 10-Year Constant Maturity U.S. Treasuries.
Our tool below is built to do that math, with the default values being the values recorded for the week of 4 July 2014 (for the "Previous Values" and for the week of 12 December 2014 (for the "Current Values"), which Hamilton recommends because they smooth out some of the big swings in values that are recorded in the day-to-day data. If you want to do the math for the current day, here is where you can obtain the data for the "Current Values" to replace the default values we've entered in the tool below:
- Investing.com: Historical Price of Copper
- Federal Reserve Economic Data: Trade-Weighted U.S. Dollar Index
- Federal Reserve Economic Data: Constant Maturity 10-Year U.S. Treasury Yield
- Federal Reserve Economic Data: Crude Oil Prices: Brent - Europe
Got all that? Here's the tool....
Using the default data, which applied for the week of 12 December 2014, we find that 42.8%, or $20.29 of the $47.45 per barrel change in Brent crude oil prices following the week of 4 July 2014 can be attributed to a negative change in global demand (from slowing national economies, particularly in Europe and Asia), while 57.2% might be attributed to the relative changes in the supply of crude oil (thanks largely to increases in U.S. oil production.)
And so, just like the recent discovery involving the causality associated with the chicken and egg dilemma, we now know not only whether its changes in demand or supply factors that are mostly driving changes in the price of oil in the world, but can now also determine tow what extent each factor is responsible!
Welcome to the blogosphere's toolchest! Here, unlike other blogs dedicated to analyzing current events, we create easy-to-use, simple tools to do the math related to them so you can get in on the action too! If you would like to learn more about these tools, or if you would like to contribute ideas to develop for this blog, please e-mail us at:
ironman at politicalcalculations
Thanks in advance!
Closing values for previous trading day.
This site is primarily powered by:
CSS Validation
RSS Site Feed
JavaScript
The tools on this site are built using JavaScript. If you would like to learn more, one of the best free resources on the web is available at W3Schools.com.
