Say what you will about the relationship between atmospheric carbon dioxide and increasingly questionable global temperature trends, perhaps the detailed scrutiny on the growing amount of carbon dioxide in the Earth's atmosphere over the modern era can perhaps be directed toward a positive purpose: measuring the state of the global economy!
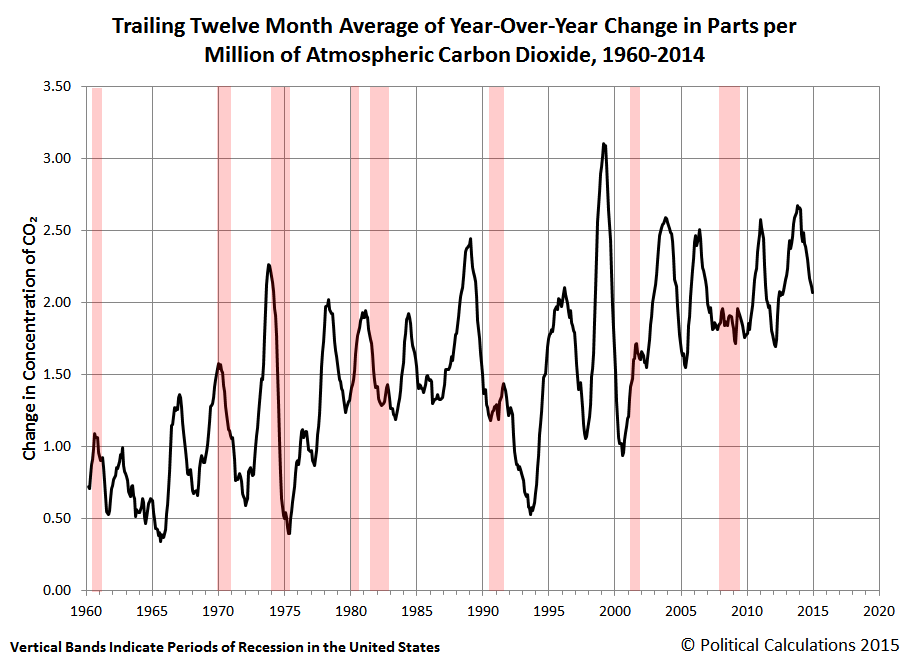
Here, we calculated the trailing twelve month average of the year-over-year change in the parts per million concentration of carbon dioxide in the Earth's atmosphere, as measured at Mauna Loa, in the middle of the Pacific Ocean, far away from the Earth's major centers of economic activity, and juxtaposed that data with the incidence of recessions in the United States.
The amazing thing that we see coming out of this juxtaposition is that it would appear that the trailing twelve month average of year over year changes in carbon dioxide levels in the Earth's atmosphere would appear to be somewhat well correlated, in real time, with the incidence of recessions in the U.S. economy, which we see in either a falling or flat level of increase in CO2 in the Earth's atmosphere.
That makes sense in that a contracting economy is likely to reduce its energy consumption which, in our largely fossil fueled world, produces a negative change in the amount of carbon dioxide in the Earth's atmosphere. Meanwhile, a growing economy is likely to produce a positive change in the measured amount of carbon dioxide.
However, the incidence of U.S. recessions does not correlate with all of the downturns in the year-over-year change in CO2 concentrations.
It occurs to us that these downturns in might be correlated with significant recessions elsewhere in the world. For example, the very large dip after 1992, which shows up after the U.S. has passed through a period of recession, would correspond to the economic distress that resulted from the collapse of the Soviet Union, which did not meaningfully affect the U.S. economy at the time, but most certainly affected a very large region in the world.
We suspect that this kind of correlation can be done to explain the other downturns, where events like Germany's, Australia's and New Zealand's 1967 recessions, or the one-two punch combination of Germany's 1996 recession that was followed by the 1997 Asian Financial Crisis. The challenge is that from what we can tell so far, there isn't a comprehensive listing of when and where recessions or other economic downturns have occurred throughout the world, which would make a full correlation difficult to produce.
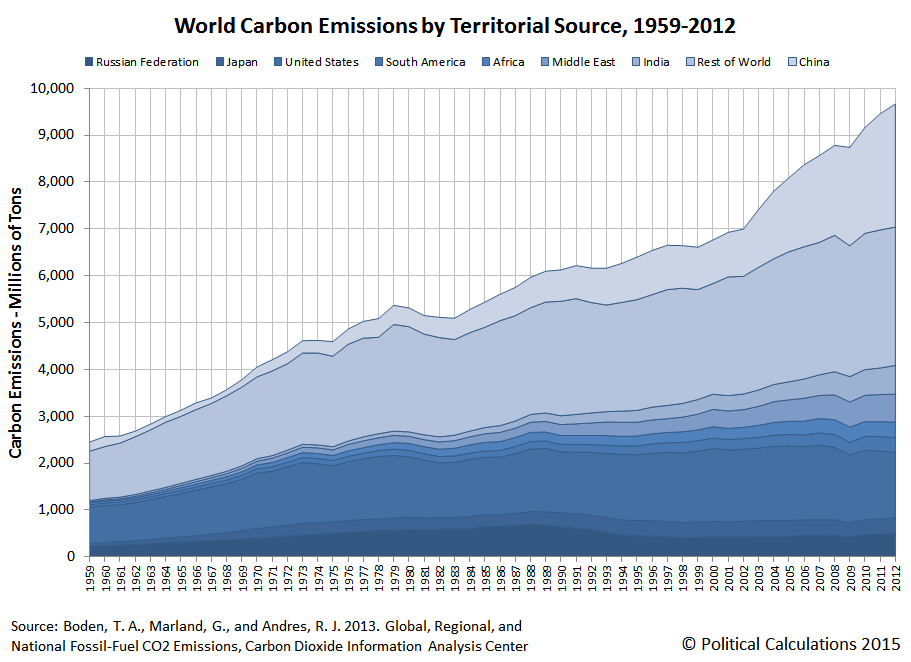
In the meantime though, we also suspect that a downturn in the year-over-year change in CO2 is signaling that there is some significant economic distress occurring somewhere in the world. And these days, that's much more likely to be China than the U.S.
So in case you were wondering about what's behind that latest downturn in the year-over-year growth of atmospheric CO2 levels....
Labels: economics, environment, recession
Welcome to the blogosphere's toolchest! Here, unlike other blogs dedicated to analyzing current events, we create easy-to-use, simple tools to do the math related to them so you can get in on the action too! If you would like to learn more about these tools, or if you would like to contribute ideas to develop for this blog, please e-mail us at:
ironman at politicalcalculations
Thanks in advance!
Closing values for previous trading day.
This site is primarily powered by:
CSS Validation
RSS Site Feed
JavaScript
The tools on this site are built using JavaScript. If you would like to learn more, one of the best free resources on the web is available at W3Schools.com.

