Some time ago, we recognized that the number of companies acting to cut their dividends each month seemed to be a very good and simple predictor of the near real time state of the U.S. economy. Today, we're going to compare our performance against the supposed best economic forecasters of the world: the U.S. Federal Reserve and the Blue Chip Economic Indicators!
How we'll do that is pretty novel. We'll compare what our simple indicator was signaling once a month about the state of the U.S. economy throughout the first quarter of 2015 against the evolution of the actual range of forecasts offered by the Blue Chip Economic Indicators and the Federal Reserve's GDPNow forecast, as documented by the research department at the Federal Reserve Bank of Atlanta as of Wednesday, 25 March 2015.
Let's start with our own analysis, with the snapshot we took of the U.S. economy at the end of 2014, which we posted on 7 January 2015:
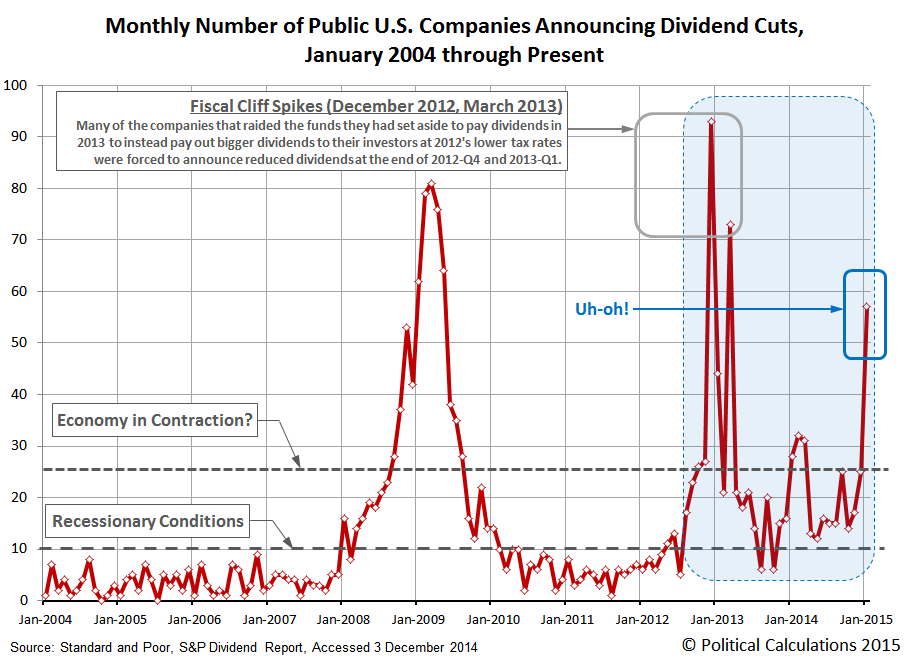
In December 2014, the number of publicly-traded U.S. companies announcing that they would reduce their dividend payments jumped up to 25, a level that we believe is consistent with contractionary distress being present within the U.S. economy.
From our observations of the limited data available, having 10 or more companies announce that they are cutting their dividend payments in a single month is sufficient to indicate that there are recessionary conditions in the U.S. economy. When that figure rises above 20 per month, it tends to coincide with some degree of contraction within the U.S. economy, which can impair the nation's GDP.
That's not to say that level of contraction qualifies as a full-bore recession - from all indications, it's more a sign that there is an increased degree of distress within the U.S. economy that is, as yet, too limited in scale, scope or duration to qualify as an official period of recession as might be determined by the National Bureau of Economic Research, which we describe being in a state of microrecession.
Next, here's our first look at how the U.S. economy was performing in the first month of the first quarter of 2015, which we posted on 3 February 2015:
Going by the number of publicly-traded companies that acted to cut their dividends in January 2015, the U.S. economy didn't just experience recessionary conditions during the month. Instead, it outright contracted.
Or perhaps a better description of what happened is that the U.S. oil industry's efforts to push its luck as far as it could has run out of good luck to push.
By that, we're referring to the consequences of falling oil prices, which are forcing an increasing number of companies tied to oil extraction activities in the United States to take the dramatic step of slashing their dividends. With 57 U.S. companies taking that action in January 2015, the number of companies taking that action in a single month is consistent only with previous months in which the U.S. economy either experienced contraction or in response to major dividend tax rate hikes.
January 2015 saw no major tax rate hikes on dividends, so contraction it is.
Our last snapshot of the state of the U.S. economy was posted on 3 March 2015 and takes us through the month of February 2015, where once again, we find that the U.S. economy was undergoing contraction.
Following its apparent contraction in January 2015, it appears that the U.S. economy continued to contract in February 2015.
We're basing that assertion on the number of publicly-traded U.S. companies that announced they would be reducing their cash dividend payments to their shareholders during the month of February 2015. With 38 companies taking that action, the number is lower than the 57 firms that took similar actions in January 2015, but is still well elevated above the number that would appear to correspond to a shrinking economy.
So there we are. On record as having described the U.S. economy as either experiencing or being in contraction at the beginning of each month in 2015-Q1.
We won't have the data for March 2015 until after the month has ended, but our early indication from our tracking of the actual announcements of firms that have acted to cut their dividends during the month is consistent with an ongoing period of contraction in the U.S. economy. We continue to believe the data indicates that the U.S. entered 2015 experiencing contraction and that it has experienced negative economic growth during the first quarter of 2015.
Now, let's see how that compares with the forecasts of the Blue Chippers and the evolution of the Fed's GDPNow indicator as it stood on 25 March 2015:
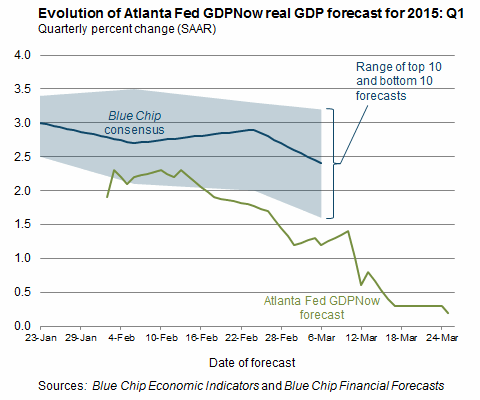
The GDPNow model forecast for real GDP growth (seasonally adjusted annual rate) in the first quarter of 2015 was 0.2 percent on March 25, down from 0.3 percent on March 17. Following this morning's advance report on durable goods manufacturing from the U.S. Census Bureau, the nowcasts for real equipment investment and real inventory investment declined slightly.
Here, we see that back in mid-to-late January 2015, which is consistent with where it entered the year, the "Blue Chip Consensus" forecast ranged from a low of 2.5% to a high of 3.4%, and was centered on a GDP growth rate of 3.0%. By the time of our second observation in early February, in which we declared that the U.S. economy was contracting, the range of the Blue Chip forecasts had widened to run from 2.1% to 3.5%, with the mid-range consensus set at 2.7%. One month later, as we indicated that the U.S. economy was continuing to experience contraction in 2015-Q1, the Blue Chippers were indicating the likely range for annualized GDP growth was now anywhere from 1.6% to 3.2%, with an overall consensus of 2.5%.
By contrast, the Fed's GDPNow forecast always ran to the low side of the range of the Blue Chip forecasts, starting at about 2.1% at the time of our contraction call in early February 2015 and falling to 1.2% at the time of our "continued contraction" call in early March 2015. Now at the end of the month, it is just 0.2% away from agreeing with our long-established assessment that the U.S. economy has been undergoing a period of economic contraction.
The difference, of course, is that we got there months ago with our very simple national economic health indicator.
Going back to 7 January 2015, you really have to feel sorry for the people who relied upon "most economists" or President Obama's Council of Economic Advisors to get their sense of the state of the U.S. economy going into the first quarter of 2015.
Labels: dividends, recession forecast
Welcome to the blogosphere's toolchest! Here, unlike other blogs dedicated to analyzing current events, we create easy-to-use, simple tools to do the math related to them so you can get in on the action too! If you would like to learn more about these tools, or if you would like to contribute ideas to develop for this blog, please e-mail us at:
ironman at politicalcalculations
Thanks in advance!
Closing values for previous trading day.
This site is primarily powered by:
CSS Validation
RSS Site Feed
JavaScript
The tools on this site are built using JavaScript. If you would like to learn more, one of the best free resources on the web is available at W3Schools.com.

