How much do wildfires contribute to the amount of carbon dioxide in the Earth's atmosphere?
That's the question we're tacking today, because a number of massive fires in Indonesia's peat-filled forests in 2015 are reputed to have dumped a considerable amount of CO2 into the air, which we think have been showing up in the Mauna Loa Observatory's measurements of the gas.
But to find out by how many parts per million that the concentration of carbon dioxide in the air may have increased as a result of the fires, we first have to know just how much CO2 is estimated to have been generated as a result of the out-of-control burning that occurred in Indonesia in 2015.
For that information, we turned to Guido van der Werf's Global Fire Data site, where we found that he had provided estimates of the number of gigatonnes of carbon dioxide equivalents for Indonesia's fire through November 2015.
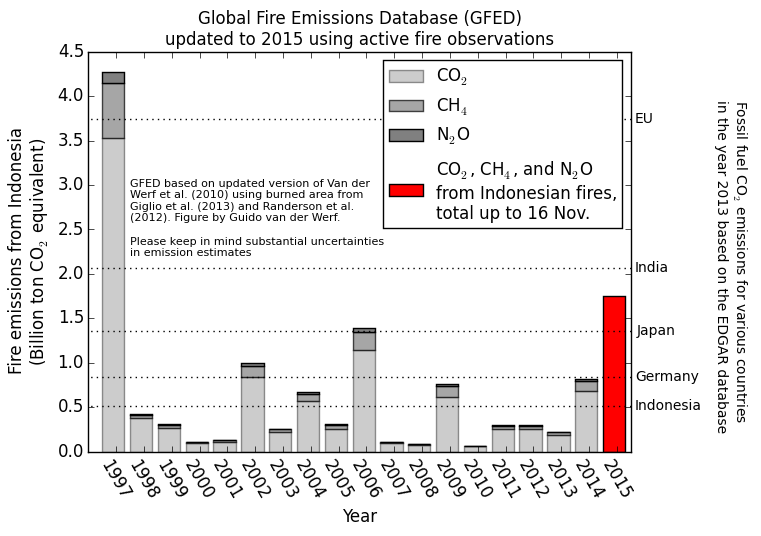
Van der Werf describes the chart's data for 2015:
We expect that the GFED estimate for the 2015 fires will be about 1.75 billion metric ton of CO2 equivalents, with substantial uncertainty.
Above the greenhouse gas emissions from Indonesian fires are plotted according to GFED for 1997-2014 with estimates for 2015 based on active fires. These are converted to emissions based on a relation between the two, established using data from previous years, see the figure and text below for more information. The numbers on the right indicate fossil fuel CO2 emissions for various countries for 2013 derived from the EDGAR database.
In general, fire CO2 emissions are compensated for by regrowing vegetation after a fire and should not be compared to fossil fuel emissions, but that is not the case when forests are burned to make way for other land uses or when peat is burned. That is exactly what happens with the vast majority of the fires in Indonesia and these fires are thus a net source of CO2 as well as other greenhouse gases.
Now that we have that data, we can use it to estimate how much carbon dioxide has actually made its way into the Earth's air as a result of all that burning. We built the following tool to do the math for us - if you're reading this article on a site that republishes our RSS news feed, please click here to access a working version of the tool.
Since the data is preliminary, we expect that the amount of actual carbon dioxide emitted into the atmosphere as a result of Indonesia's 2015 wildfires will ultimately turn out to be different than the 1.75 billion metric tons indicated, but at least we have a starting point from which to do the estimation.
As for what we can do with the estimation, we thought it might be interesting to see how much it affected the year over year change in the amount of carbon dioxide that is measured by the Mauna Loa Observatory in the Earth's atmosphere. The following chart reveals our results, but what's more, we went the extra mile to also visualize just how much Indonesia's 1997 wildfires, the largest recorded in modern world history, contributed to the observed change in atmospheric CO2 levels as it disseminated around the globe.
While both the 1997 and 2006 wildfires occurred during strong El Niño years, which contributed to the dry weather conditions in Indonesia that facilitated the large scale wildfires in those years, the mere onset of even strong El Niño conditions is no guarantee that such wildfires will ignite and spread out of control and pump as much carbon dioxide into the atmosphere as they did in both 1997 and 2015.
Considering our chart above, it's also important to note that the rate of diffusion of carbon dioxide in the Earth's atmosphere from a single geographic region can cause the parts per million of the gas that is measured at the remote, dormant volcano-based observatory to increase for months after the fires came to an end. At this writing, it may have peaked, but we won't know for sure for several months.
On the whole however, the much more controlled means by which carbon dioxide enters the Earth's atmosphere through human activity would appear be a more significant contributor to the changes observed in the rate at which the atmospheric concentration of CO2 changes over time.
Data Sources
National Oceanographic and Atmospheric Administration. Earth System Research Laboratory. Mauna Loa Observatory CO2 Data. [File Transfer Protocol Text File]. Updated 5 April 2016. Accessed 10 April 2016.
Van der Werf, Guido. Global Fire Data. [Online Text]. Accessed 10 April 2016.
Labels: environment, tool
Welcome to the blogosphere's toolchest! Here, unlike other blogs dedicated to analyzing current events, we create easy-to-use, simple tools to do the math related to them so you can get in on the action too! If you would like to learn more about these tools, or if you would like to contribute ideas to develop for this blog, please e-mail us at:
ironman at politicalcalculations
Thanks in advance!
Closing values for previous trading day.
This site is primarily powered by:
CSS Validation
RSS Site Feed
JavaScript
The tools on this site are built using JavaScript. If you would like to learn more, one of the best free resources on the web is available at W3Schools.com.


